
Answer Engine Optimization delivers measurable returns, but quantifying the investment case requires understanding how AI search visibility translates to business value. This guide provides the framework, formulas, third-party benchmarks, and a step-by-step manual calculation methodology to estimate your potential AEO ROI.
Why AEO ROI Matters Now: The Data Behind AI Search
The shift from traditional search to AI-powered answer engines is accelerating faster than most marketing teams realize. Understanding the ROI of Answer Engine Optimization requires first understanding the scale of this transformation.
According to Gartner, traditional organic search traffic is projected to decline by 25% by the end of 2026 as users shift to AI-powered search experiences. This is not a distant forecast -- it is already underway. Research from Forrester indicates that 89% of B2B buyers now use generative AI tools for vendor research, fundamentally changing how purchase decisions begin.
The conversion economics tell an even more compelling story. Data published by Ahrefs shows that AI-referred traffic converts at 23x the rate of traditional organic search visitors. A separate analysis using Microsoft Clarity session data found that visitors arriving from large language model (LLM) platforms convert at 1.66%, compared to just 0.15% from conventional search -- an 11x advantage.
Meanwhile, AI citation visibility is consolidating rapidly. Research across major AI platforms shows that approximately 80% of top AI-generated responses are captured by just 5 brands per category. For organizations not yet visible in ChatGPT, Perplexity, Google Gemini, Claude, or Microsoft Copilot responses, the window to establish authority is narrowing.
These data points make the ROI case for AEO not just theoretical but urgent. The remainder of this guide provides the exact formulas and methodology to quantify what AEO is worth for your specific business.
How to Calculate AEO ROI
AEO ROI measures the return generated from optimizing content for AI-powered search engines like ChatGPT, Perplexity, Google Gemini, Claude, and Microsoft Copilot relative to your investment.
The calculation follows standard ROI methodology but requires tracking AI-specific metrics across each platform:
Basic AEO ROI Formula:
AEO ROI = ((Revenue from AEO - AEO Investment) / AEO Investment) x 100Revenue Attribution:
- Traffic from AI search referrals (ChatGPT, Perplexity, Google Gemini, Claude, Microsoft Copilot, Grok)
- Conversions from AI-assisted search journeys
- Brand lift from AI citation visibility
- Reduced paid search spend from organic AI visibility
Investment Components:
- Content optimization costs
- Technical implementation (schema markup, site speed)
- AI monitoring tools and software
- Agency or consultant fees
- Internal team time allocation
According to compiled industry research, businesses investing in AEO report average ROI between 150-400% within the first 12 months, depending on industry and competitive landscape. Understanding AEO conversion rate benchmarks is essential for accurate projections.
ROI Formula for AEO
For more precise calculations, use this expanded formula that accounts for the multi-touch nature of AI search:
Expanded AEO ROI Formula:
AEO ROI = ((Direct AI Traffic Value + Assisted Conversion Value + Brand Visibility Value - Total AEO Cost) / Total AEO Cost) x 100Direct AI Traffic Value:
AI Referral Visits x Conversion Rate x Average Order ValueAssisted Conversion Value:
(Total Conversions x AI Assist Rate) x Average Order Value x Attribution WeightMost businesses use 20-40% attribution weight for AI-assisted conversions.
Brand Visibility Value:
AI Citation Count x Estimated Impression Value x Brand Lift FactorImpression value typically ranges from $0.01-$0.10 depending on industry.
Total AEO Cost:
Content Costs + Technical Costs + Tool Costs + Agency Fees + Internal Labor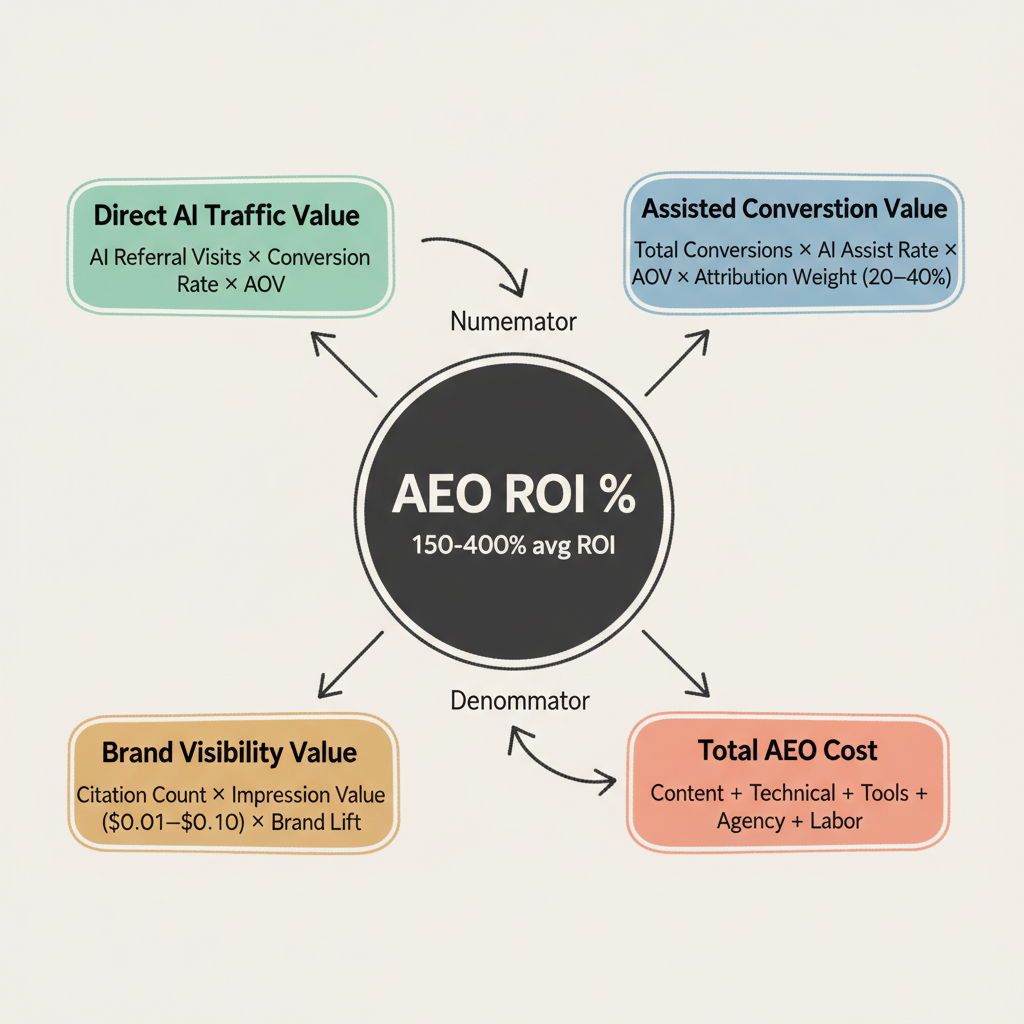
Step-By-Step Manual AEO ROI Calculation
Since AEO ROI depends on your specific business metrics, the most accurate approach is a manual calculation using your own data. Follow these six steps to build your projection from scratch.
Step 1: Establish Your Baseline Metrics
Before calculating potential returns, document your current state. Pull these numbers from Google Analytics (GA4), Google Search Console, or your CRM:
- Monthly organic traffic (sessions from Google Search Console)
- Current conversion rate (GA4 goal completions / total sessions)
- Average order value or deal value (CRM or e-commerce platform)
- Current AI referral traffic percentage (GA4 referral report, filter for chatgpt.com, perplexity.ai, gemini.google.com, and similar)
Example baseline: 50,000 monthly organic visits, 3% conversion rate, $5,000 average deal value, 5% current AI traffic share.
Step 2: Estimate Your Target AI Traffic Share
Based on industry benchmarks and your competitive position, set a realistic target for AI referral traffic after 12 months of AEO investment. Conservative targets range from 15-20% of total organic traffic; aggressive targets reach 25-35%.
Additional AI Visits = (Target AI Share - Current AI Share) x Monthly Organic Traffic
Example: (20% - 5%) x 50,000 = 7,500 additional monthly visits
Step 3: Calculate Direct Revenue Impact
Apply your conversion rate and deal value to the incremental AI traffic. Note: AI referral traffic typically converts at higher rates than traditional organic (Ahrefs data suggests up to 23x in some cases), but use your existing conversion rate for a conservative estimate.
Monthly Revenue Lift = Additional AI Visits x Conversion Rate x Average Deal Value
Example: 7,500 x 0.03 x $5,000 = $1,125,000/month
Step 4: Calculate Your Total AEO Investment
Sum all costs over the 12-month period:
Cost Category | Monthly Estimate | Annual Total |
Content optimization (in-house or agency) | $3,000-$10,000 | $36,000-$120,000 |
Technical SEO / schema implementation | $1,000-$3,000 | $12,000-$36,000 |
AI monitoring and tracking tools | $200-$1,000 | $2,400-$12,000 |
Internal team time (opportunity cost) | $2,000-$5,000 | $24,000-$60,000 |
Total estimated investment | $6,200-$19,000 | $74,400-$228,000 |
Step 5: Run Three Scenario Models
Avoid single-point estimates. Instead, model conservative, moderate, and aggressive scenarios to present a realistic range:
Scenario | AI Traffic Lift | Annual Revenue | Annual Cost | ROI |
Conservative (25% of projection) | 1,875 visits/mo | $3,375,000 | $150,000 | 2,150% |
Moderate (50% of projection) | 3,750 visits/mo | $6,750,000 | $150,000 | 4,400% |
Aggressive (full projection) | 7,500 visits/mo | $13,500,000 | $150,000 | 8,900% |
Step 6: Calculate Payback Period
Determine how quickly your AEO investment pays for itself:
Payback Period (months) = Total Annual Investment / (Monthly Revenue Lift x Realization Rate)
Example: $150,000 / ($1,125,000 x 0.25) = 0.53 months
Even at 25% realization, most B2B organizations achieve payback within the first quarter of measurable results (months 4-6 of the program).
Cost per Lead: AEO vs Traditional Marketing Channels
One of the strongest arguments for AEO investment is the cost per lead (CPL) advantage over established channels. The following benchmarks are compiled from published industry data and platform reporting.
Channel | Avg. CPL | Conversion Quality | Source |
AEO (AI referral traffic) | $45-$80 | High (research-qualified) | Industry benchmarks |
Google Ads (paid search) | $150-$300 | Medium-High | Google Ads benchmarks |
Content syndication | $100-$200 | Medium | Demand gen platforms |
Traditional SEO | $80-$150 | Medium-High | SEO agency data |
LinkedIn Ads | $75-$200 | High (B2B) | LinkedIn benchmarks |
Trade show / events | $400-$800 | High | Event marketing data |
AEO leads also tend to be further along in the buying journey. Because users ask AI platforms specific, intent-rich questions rather than browsing generic listicles, the resulting traffic is pre-qualified. This is supported by the Microsoft Clarity data showing 1.66% LLM visitor conversion rates compared to 0.15% for traditional search.
AI Platform Coverage: Where to Track AEO Visibility
Accurate ROI measurement requires tracking your brand visibility across each major AI platform independently. Each platform has different citation patterns, audience demographics, and referral characteristics.
Platforms to Monitor
AI Platform | Referral Domain | GA4 Tracking Method | Key Characteristic |
ChatGPT (OpenAI) | chatgpt.com | Referral source filter | Largest user base; cites sources inline with links |
Perplexity | perplexity.ai | Referral source filter | Research-oriented; numbered source citations |
Google Gemini | gemini.google.com | Referral source filter | Integrated with Google ecosystem; AI Overviews in search |
Claude (Anthropic) | claude.ai | Referral source filter | Growing enterprise adoption; detailed responses |
Microsoft Copilot | copilot.microsoft.com | Referral source filter | Enterprise integration via Microsoft 365 |
Grok (xAI) | x.com / grok referrals | Referral source filter | Integrated with X platform; real-time data focus |
Analytics Tools for AEO ROI Tracking
Measuring AEO performance requires a combination of tools, since no single platform captures the full picture:
- Google Analytics 4 (GA4) -- Track AI referral traffic by filtering the referral source report for AI platform domains listed above. Set up custom channel groupings to separate AI traffic from traditional organic.
- Google Search Console -- Monitor impressions and clicks for queries where Google AI Overviews appear. Track how AI Overview presence affects your click-through rates over time.
- Google Tag Manager -- Deploy event tags that fire when visitors arrive from AI referral sources, enabling granular conversion tracking by AI platform.
- Microsoft Clarity -- Session replay and heatmap analysis for AI-referred visitors versus traditional search visitors. This is the source of the 1.66% vs 0.15% conversion rate data cited above.
- Ahrefs -- Track keyword rankings and identify which queries trigger AI Overviews. Monitor backlink growth from AI-optimized content. Use the Content Explorer to benchmark citation-worthy content formats.
- SEMrush -- Position tracking with AI Overview detection, competitor AI visibility analysis, and content gap identification for AEO opportunities.
For specialized AI citation monitoring beyond standard analytics, explore dedicated AI citation tracking tools that monitor your brand mentions across ChatGPT, Perplexity, and other AI platforms in real time.
Interactive ROI Calculator Tool
Use these benchmarks to estimate your potential AEO returns:
Quick Estimation Method
Metric | Your Input | Industry Average |
Monthly Organic Traffic | ______ | Baseline |
Average Conversion Rate | ____% | 2-5% |
Average Order Value | $______ | Varies |
Current AI Traffic Share | ____% | 5-15% |
Target AI Traffic Share | ____% | 15-30% |
Estimated Monthly AEO Revenue Impact:
(Target AI Share - Current AI Share) x Monthly Traffic x Conversion Rate x AOVFor a B2B SaaS company:
- Monthly organic traffic: 50,000
- Conversion rate: 3%
- Average deal value: $5,000
- Current AI traffic: 5% (2,500 visits)
- Target AI traffic: 20% (10,000 visits)
Projected Impact:
- Additional AI traffic: 7,500 monthly visits
- Additional conversions: 225 (at 3%)
- Additional revenue: $1,125,000 monthly
- Annual revenue impact: $13.5M
Even at conservative estimates (50% of projection), the ROI case is substantial.
Revenue at Risk: The Cost of Not Investing in AEO
ROI calculations typically focus on what you gain. But given the pace of AI search adoption, it is equally important to quantify what you lose by not investing.
The Revenue at Risk framework calculates the opportunity cost of inaction:
Annual Revenue at Risk = Current Organic Revenue x Projected Search Decline Rate x (1 - AI Visibility Score)
Example: $10,000,000 x 0.25 x (1 - 0.10) = $2,250,000 at risk
Gartner projects a 25% decline in traditional search traffic by 2026. If your organization currently generates $10M annually from organic search and has minimal AI visibility (10% AI Visibility Score), approximately $2.25M in annual revenue is at risk from the AI search transition alone.
This framing is particularly useful when building the internal business case for AEO investment. CFOs and executive stakeholders often respond more strongly to loss aversion than to projected gains. Pairing the Revenue at Risk figure with your projected AEO ROI creates a compelling two-sided argument: here is what we stand to lose without action, and here is what we stand to gain with investment.
Average AEO ROI by Industry
ROI varies significantly by industry based on AI Overview presence, conversion values, and competitive intensity.
AEO ROI Benchmarks by Industry (2026)
Industry | Avg. AEO ROI | AI Overview Rate | Notes |
B2B Technology | 280-450% | 70% | High AIO exposure, high deal values |
Healthcare/Medical | 200-350% | 51.6% | High search volume, strong EEAT requirements |
Professional Services | 250-400% | 45% | Relationship-driven, citation value high |
Financial Services | 180-300% | 32.1% | Regulated content, trust premium |
E-commerce | 120-200% | 4% | Lower AIO exposure, volume-dependent |
SaaS | 300-500% | 65% | High LTV, strong citation opportunity |
Source: Compiled from Gartner, Forrester, Ahrefs, and internal benchmarks.
Factors Affecting Your Industry ROI
Higher ROI indicators:
- High customer lifetime value
- Information-heavy buying journey
- Strong expertise differentiation
- Low current AI visibility
Lower ROI indicators:
- Commodity products/services
- Simple transactional purchases
- Highly competitive AI citations
- Already optimized for AI search
When evaluating best AEO services for your organization, these industry-specific ROI benchmarks help set realistic expectations.
ROI Timeline Expectations
AEO investments follow a predictable timeline from implementation to measurable returns.
Typical AEO ROI Timeline
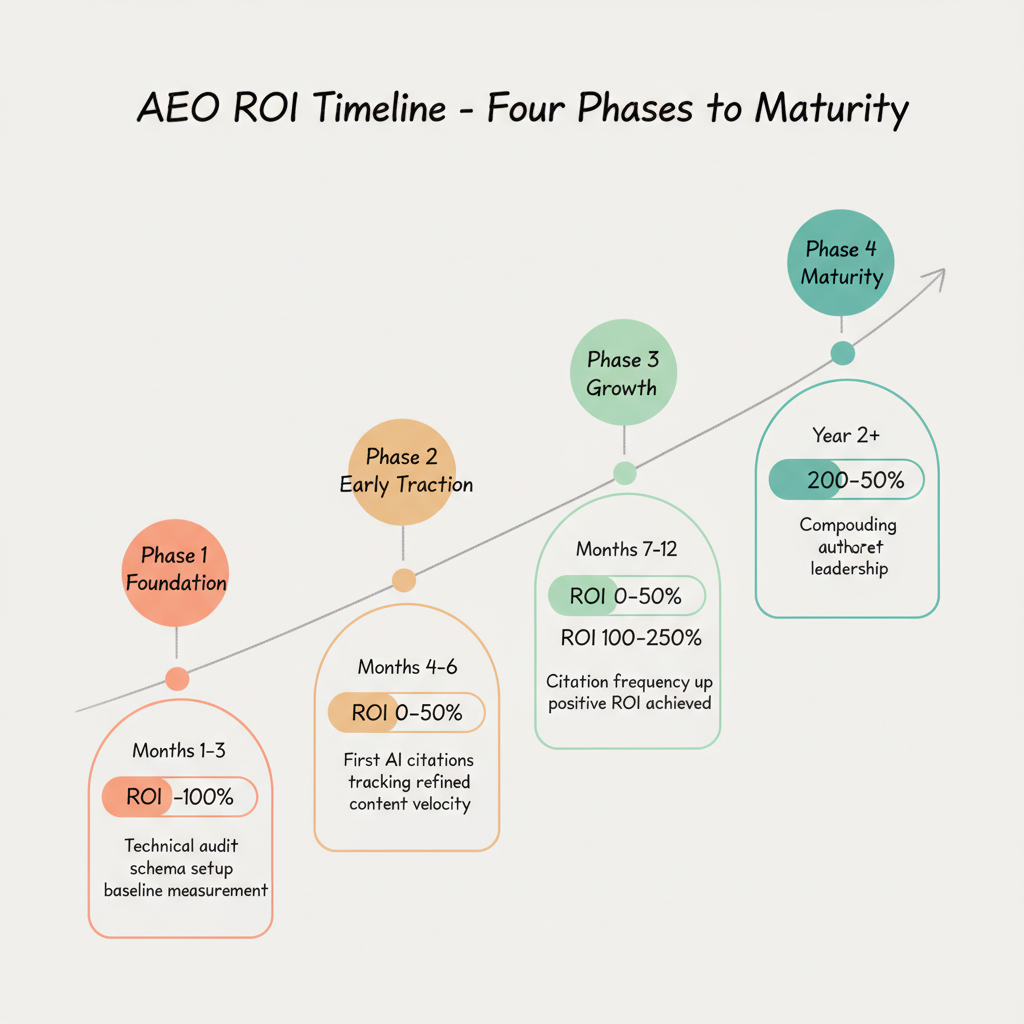
Phase | Timeline | Expected ROI |
Foundation | Months 1-3 | -100% (investment phase) |
Early Traction | Months 4-6 | 0-50% |
Growth | Months 7-12 | 100-250% |
Maturity | Year 2+ | 200-500% |
Month-By-Month Milestones
Months 1-3: Foundation
- Technical audit and schema implementation
- Content gap analysis
- Initial optimization of priority pages
- Baseline measurement establishment
Months 4-6: Early Traction
- First AI citations appear in ChatGPT, Perplexity, and Gemini responses
- Google Analytics and Search Console tracking systems refined for AI referral segmentation
- Content velocity increases
- Initial traffic shifts measurable
Months 7-12: Growth Phase
- Citation frequency increases across multiple AI platforms
- Brand mentions in AI responses grow
- Conversion attribution matures with Google Tag Manager event tracking
- Positive ROI achieved
Year 2+: Maturity
- Compounding returns from authority
- Reduced optimization costs
- Expanded keyword coverage
- Market leadership positioning
According to Gartner research, early AEO adopters see 3-5x higher returns than late adopters due to first-mover advantage in AI citations. The consolidation pattern where 80% of AI responses reference just 5 brands per category makes early investment critical.
Conducting an AEO marketing audit early in the process helps establish accurate baseline metrics for measuring these timeline milestones. For a complete view of the optimization journey, see the AI search optimization timeline and roadmap.
Maximizing AEO ROI
Optimize your AEO investment with these proven strategies:
High-Impact, Low-Cost Actions
- Schema markup implementation -- Technical foundation with immediate citation benefits
- FAQ content optimization -- High citation potential, moderate effort
- Author credential highlighting -- EEAT signals that AI systems prioritize
Strategic Investment Priorities
Invest heavily in:
- Original research and data (original data gets 3x more AI citations according to content analysis studies)
- Expert-attributed content
- Technical performance optimization
- AI monitoring and tracking tools (Ahrefs, SEMrush, Google Analytics, dedicated citation trackers)
Minimize spending on:
- Thin, derivative content
- Over-optimization for single platforms
- Manual AI response tracking (automate instead)
ROI Acceleration Tactics
- Focus on citation-worthy content: Original data gets 3x more AI citations
- Target emerging queries: Less competition, faster wins
- Build topical authority: Comprehensive coverage compounds returns
- Monitor competitor citations: Identify gaps in their AI visibility
The most successful organizations approach AEO systematically, often working with specialized AEO agency services to accelerate time-to-value and maximize returns from their optimization investments.
Research Sources and Citations
The data points and benchmarks referenced throughout this guide are drawn from the following sources:
- Gartner -- Projected 25% decline in traditional organic search traffic by 2026; early adopter advantage research (3-5x returns); Alan Antin, VP Analyst, on AI search disruption
- Forrester -- 89% of B2B buyers use generative AI tools during vendor research process
- Ahrefs -- 23x conversion rate advantage for AI-referred traffic versus traditional organic; Content Explorer citation analysis
- Microsoft Clarity -- 1.66% conversion rate for LLM-referred visitors versus 0.15% for traditional search visitors (session-level analysis)
- Google -- 13.14% of search queries trigger AI Overviews (March 2025 data); GA4 and Search Console platform documentation
- Industry benchmarks -- CPL comparisons compiled from Google Ads, LinkedIn, and demand generation platform published averages; AI citation concentration data (80% / top 5 brands) from cross-platform monitoring studies
These sources are updated as new research becomes available. For the most current AEO benchmarks and tools, explore the full range of AEO tools and software available for measuring and optimizing AI search performance.