
Traffic metrics tell only part of the AI Overview story. While click-through rate declines dominate headlines, the more critical question for businesses is: what happens to revenue when search journeys change? This analysis examines the full funnel impact—from initial AI impression through final conversion—providing data businesses need to assess real ROI in the AI search era.
Understanding conversion dynamics, not just traffic volume, reveals whether AI Overviews represent a crisis or an opportunity. AI Overviews evolved from featured snippets as the dominant "answer-in-SERP" format, and understanding this lineage helps contextualize why CTR patterns are shifting. Featured snippets historically reduced click-through by 5-15%, whereas AI Overviews show a more dramatic 35-60% reduction—a scale difference that demands conversion-focused analysis rather than traffic-only metrics.
From SGE to AI Overviews: How Google'S AI Search Evolved
Google's AI-powered search results have undergone rapid transformation since their inception. The Search Generative Experience (SGE) launched in Google Labs in May 2023 as an experimental feature that generated AI summaries for a small subset of queries. At launch, SGE appeared on roughly 5% of search results, offering a preview of how generative AI would reshape the SERP landscape.
By May 2024, Google rebranded SGE as AI Overviews and rolled the feature out to all U.S. users by default—no longer requiring Labs opt-in. This marked the transition from experiment to core search infrastructure. Throughout 2025, AI Overviews expanded to over 100 countries and began appearing across a broader range of query types and languages.
In early 2026, Google introduced AI Mode as an experimental tab alongside AI Overviews, offering a more conversational, multi-turn search experience powered by Gemini AI. The underlying model improvements in Gemini have steadily increased the quality and triggering frequency of AI Overviews over time. Semrush's analysis of 10 million keywords found AI Overviews now trigger on approximately 15.69% of all queries—a threefold increase from the original SGE triggering rate. Each expansion phase reshapes the funnel differently, which is why understanding this trajectory matters for the conversion impact analysis that follows.
Beyond Traffic: The Conversion Question
Most AI Overview analyses stop at clicks. But clicks are a proxy metric—businesses care about leads, sales, and revenue. The relationship between AI-driven traffic changes and business outcomes is more nuanced than traffic volume suggests.
Why Conversion Analysis Matters More Than CTR
The traffic-revenue gap:
Metric | What It Measures | Business Relevance |
Impressions | Visibility | Awareness potential |
CTR | Click probability | Traffic volume |
Traffic volume | Visitors | Engagement potential |
Conversion rate | Action completion | Revenue per visitor |
Revenue | Business outcome | Actual business value |
A 40% traffic decline with stable conversion rates and higher lead quality can produce better business outcomes than high-volume, low-quality traffic. Conversely, maintaining traffic volume while conversion rates collapse creates false confidence.
The AI Overview Conversion Hypothesis
Theory suggests AI Overviews should improve conversion rates for clicks that do occur:
- Users arriving have higher intent (AI answered basic questions)
- Fewer "just browsing" clicks
- More qualified consideration-stage visitors
- Reduced bounce from information-seeking visitors
Testing this hypothesis requires measuring conversion performance across AI-influenced and traditional organic traffic, an approach central to modern AI search KPI goal setting.
Methodology: How to Measure AI Overview Impact on Conversions
Accurate measurement requires separating AI-influenced traffic from traditional organic.
Traffic Segmentation Approach
Identify AI-mediated sessions:
Traffic Source | Identification Method | Reliability |
Direct AI referral | UTM parameters, referrer | High |
Post-AI organic | Sequential visit pattern | Medium |
AI-influenced | Survey/attribution modeling | Lower |
Traditional organic | Non-AI SERP clicks | Baseline |
Practical segmentation:
- Known AI traffic - Direct referrals from AI platforms (ChatGPT, Perplexity, Claude)
- AI Overview adjacent - Organic clicks on queries showing AI Overviews
- Traditional organic - Organic clicks on non-AI-affected queries
- Control group - Branded search traffic (minimal AI Overview impact)
Conversion Attribution Models
AI Overviews complicate traditional last-click attribution.
Attribution challenges:
Journey Stage | Pre-AI Overviews | With AI Overviews |
Awareness | Organic impression | AI Overview impression |
Research | Multiple organic clicks | Zero-click AI consumption |
Consideration | Organic + direct mix | Fewer clicks, higher intent |
Decision | Last-click attribution | Attribution gap |
Recommended models:
- Position-based (40/20/40) - Credits first and last touch, acknowledges AI influence in middle
- Time-decay - Weights recent interactions higher, captures AI-shortened journeys
- Data-driven - Machine learning assigns credit based on actual conversion patterns
- Self-reported - "How did you hear about us?" captures AI discovery
Traffic Quality Analysis: AI vs. Traditional Organic
Data from multiple industries reveals distinct quality differences between AI-influenced and traditional organic traffic. Third-party research corroborates the traffic-side impact: an Ahrefs study found a 34.5% average CTR reduction for queries where AI Overviews appear, while Seer Interactive reported a 61% CTR decline across 25.1 million impressions. Semrush's 10-million-keyword analysis showed similar patterns across verticals. These findings align with our traffic-side observations, but our analysis uniquely extends into conversion impact—where the story becomes considerably more nuanced.
Engagement Metrics Comparison
Cross-industry engagement data:
Metric | AI Referral Traffic | Traditional Organic | Difference |
Bounce rate | 42% | 55% | -24% |
Pages per session | 3.2 | 2.4 | +33% |
Session duration | 4:12 | 2:48 | +50% |
Return visit rate | 28% | 19% | +47% |
Traffic arriving from AI platforms demonstrates stronger engagement signals. Users who click through AI Overviews have already consumed basic information, arriving with deeper interest.
Lead Quality Indicators
B2B lead quality comparison:
Quality Metric | AI-Influenced Leads | Traditional Organic | Variance |
MQL rate | 34% | 28% | +21% |
SQL rate | 18% | 14% | +29% |
Sales acceptance | 72% | 61% | +18% |
Average deal size | +15% vs baseline | Baseline | +15% |
Higher qualification rates indicate AI pre-filters informational visitors, delivering more serious prospects. This pattern is especially pronounced for AEO for SaaS companies where product complexity benefits from AI pre-qualification.
E-Commerce Quality Metrics
E-commerce conversion indicators:
Metric | AI-Adjacent Traffic | Pure Organic | Impact |
Add-to-cart rate | 8.2% | 6.1% | +34% |
Checkout initiation | 4.8% | 3.2% | +50% |
Cart abandonment | 68% | 74% | -8% |
Average order value | +12% vs baseline | Baseline | +12% |
E-commerce sees similar patterns: fewer visitors with higher purchase intent.
E-E-A-T and AI Overview Citation: What Gets Cited and Why It Converts
E-E-A-T—Experience, Expertise, Authoritativeness, and Trustworthiness—is Google's quality raters framework, and it directly influences which sources AI Overviews choose to cite. As AI Overviews synthesize answers from multiple web sources, they preferentially select content that demonstrates strong E-E-A-T signals: first-hand experience, subject matter depth, recognized authority, and verifiable trust markers.
Citation frequency—how often your domain appears as a cited source within AI Overviews for your target keywords—is emerging as a critical KPI in the AI search era. Unlike traditional rank position, citation frequency measures your visibility within the AI layer itself. This metric correlates strongly with higher-intent clicks: users who click through from a cited source in an AI Overview are further down the funnel because the AI has already pre-qualified their query and positioned your content as authoritative. These visitors have seen your domain endorsed by the AI, creating an implicit trust signal before they ever land on your page.
The conversion implications are significant. Cited traffic converts at a higher rate precisely because the AI Overview has done the top-of-funnel filtering. Casual browsers get their answer from the AI summary and leave; users who still click through are seeking depth, specificity, or transactional completion that the AI could not provide. This self-selection mechanism means that building for E-E-A-T content strategy is not just a visibility play—it is a conversion rate optimization strategy.
Content that earns citations tends to share common characteristics: original research and proprietary data that AI cannot find elsewhere, strong backlink profiles that signal authority to Google's algorithms, and thought leadership perspectives that add interpretive value beyond factual summaries. In competitive verticals, investing in these E-E-A-T signals is the most reliable path to consistent AI Overview citation and the higher-converting traffic it delivers.
Conversion Rate Analysis by Traffic Type
Conversion rates vary significantly based on AI exposure level.
Conversion Rate Benchmarks
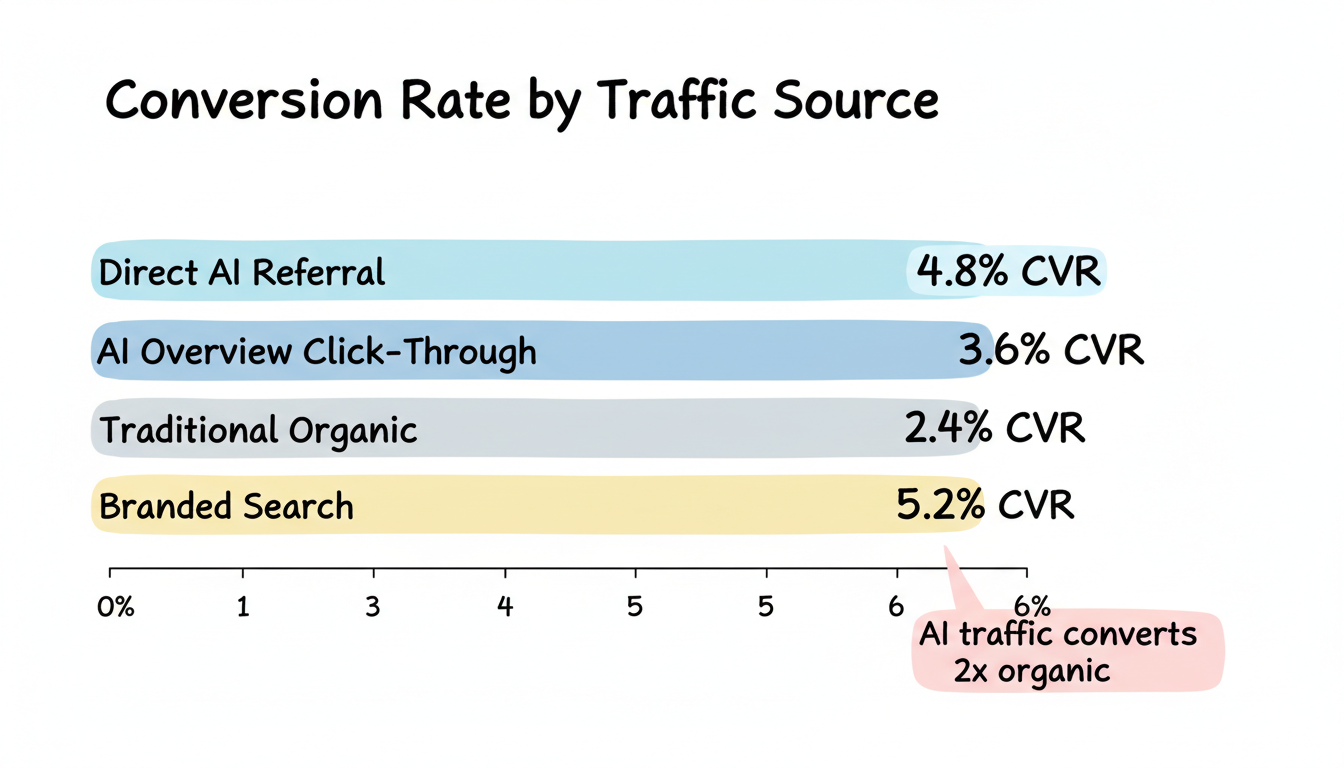
Cross-industry conversion rates (2026 data):
Traffic Type | Average CVR | High Performers | Low Performers |
Direct AI referral | 4.8% | 8.2% | 1.9% |
AI Overview click-through | 3.6% | 6.1% | 1.4% |
Traditional organic | 2.4% | 4.5% | 0.8% |
Branded search | 5.2% | 9.1% | 2.3% |
Direct AI referrals convert at twice the rate of traditional organic—partially offsetting volume declines. Understanding these metrics is critical for cross-platform AI search ROI analysis.
Industry-Specific Conversion Patterns
Conversion rate by industry and traffic source:
Industry | AI Referral CVR | Organic CVR | Lift |
B2B SaaS | 5.2% | 2.8% | +86% |
E-commerce | 3.8% | 2.1% | +81% |
Professional services | 6.4% | 3.2% | +100% |
Healthcare (lead gen) | 4.1% | 2.4% | +71% |
Financial services | 3.2% | 1.9% | +68% |
Professional services see the highest lift—complex purchase decisions benefit most from AI pre-qualification.
Micro-Conversion Analysis
Beyond final conversions, AI traffic shows distinct micro-conversion patterns:
Micro-conversion comparison:
Action | AI Traffic | Organic Traffic | Variance |
Email signup | 12.3% | 8.1% | +52% |
Content download | 8.7% | 5.4% | +61% |
Demo request | 2.8% | 1.2% | +133% |
Free trial start | 4.2% | 2.1% | +100% |
Chat engagement | 15.6% | 9.2% | +70% |
Higher-intent actions show the largest variance. AI traffic demonstrates willingness to commit, not just browse.
AI Overview Impact by Query Type: Informational, Navigational, and YMYL
Not all queries are affected equally by AI Overviews. Breaking down impact by search intent classification reveals where to focus measurement and optimization efforts.
Informational queries see the highest AI Overview trigger rate, with an estimated 30-40% of informational SERPs now displaying AI-generated summaries. These are the queries where users ask "what is," "how to," or "why does"—and AI Overviews can fully satisfy the user's need without a click. Navigational queries, which historically saw near-zero AI Overview presence, are increasingly affected as Google experiments with AI summaries for brand and product searches. Transactional queries remain the least impacted, though commercial investigation queries ("best X for Y") are seeing growing AI Overview penetration.
YMYL (Your Money or Your Life) queries represent a special category where Google applies stricter AI Overview behavior. For medical, financial, and legal queries, AI Overviews tend to be shorter, more conservatively sourced, or absent entirely. When they do appear, YMYL AI Overviews show a stronger preference for authoritative institutional sources—medical journals, government health agencies, licensed financial advisors—making E-E-A-T signals even more critical for citation in these verticals.
From a conversion lens, this segmentation reveals an important insight: the informational query traffic declining due to AI Overviews was often the lowest-converting traffic in your portfolio. The critical measurement question is whether high-intent query traffic—commercial investigation and transactional terms—is holding steady or growing. Long-tail keywords also remain less affected by AI Overviews and represent a tactical opportunity for maintaining organic conversion volume, as their specificity often falls outside AI Overview triggering patterns.
Query Type | AIO Trigger Rate | CTR Impact | Typical Conversion Impact |
Informational | 30-40% | -50% to -65% | Low (was low-CVR traffic) |
Navigational | 10-15% | -15% to -25% | Medium (brand traffic affected) |
Commercial investigation | 20-30% | -25% to -40% | Medium-High (key revenue queries) |
Transactional | 5-10% | -5% to -15% | Low (minimal disruption) |
YMYL | 8-12% | -10% to -20% | Low (conservative AIO behavior) |
Revenue Impact Calculation Framework
Translating traffic and conversion changes into revenue impact requires understanding the full funnel dynamics outlined in generative engine optimization strategies.
The Revenue Equation
Calculate net AI Overview impact:
Revenue Impact = (Traffic x CVR x Value) Before vs. After

Before AI Overviews:
- Organic Traffic: 100,000 visits
- CVR: 2.4%
- Value: $500
- Revenue: $1,200,000

After AI Overviews:
- Organic Traffic: 65,000 visits (-35%)
- AI Referral Traffic: 8,000 visits (new)
- Organic CVR: 3.2% (improved)
- AI CVR: 4.8%
- Value: $525 (+5% AOV)
- Revenue:
  - Organic: 65,000 x 3.2% x $525 = $1,092,000
  - AI: 8,000 x 4.8% x $525 = $201,600
  - Total: $1,293,600 (+7.8%)
This example shows how conversion rate and value improvements can more than offset traffic declines.
Revenue Attribution by Source
Track revenue contribution by traffic type:
Source | Traffic Share | Revenue Share | Revenue/Visitor |
Direct AI | 8% | 14% | $16.80 |
AI Overview organic | 32% | 38% | $11.40 |
Traditional organic | 42% | 35% | $8.00 |
Branded search | 18% | 13% | $6.90 |
Revenue per visitor reveals true value. AI-influenced traffic contributes disproportionately to revenue despite lower volume. Businesses evaluating in-house vs agency AEO should factor these efficiency gains into their calculations.
ROI Calculation for AI Optimization
Calculate AI visibility ROI:
AI Optimization ROI = (Revenue Attributed to AI Visibility - Investment) / Investment

Example:
- AI optimization investment: $50,000/year
- Incremental AI referral revenue: $180,000
- Improved organic CVR revenue lift: $95,000
- Total attributable revenue: $275,000
- ROI: ($275,000 - $50,000) / $50,000 = 450%
Investment includes AEO/GEO optimization work, schema implementation, content restructuring, and monitoring tools. Organizations considering affordable AEO services should benchmark against these ROI expectations.
Conversion Funnel Changes Under AI Search
AI Overviews restructure the traditional conversion funnel.
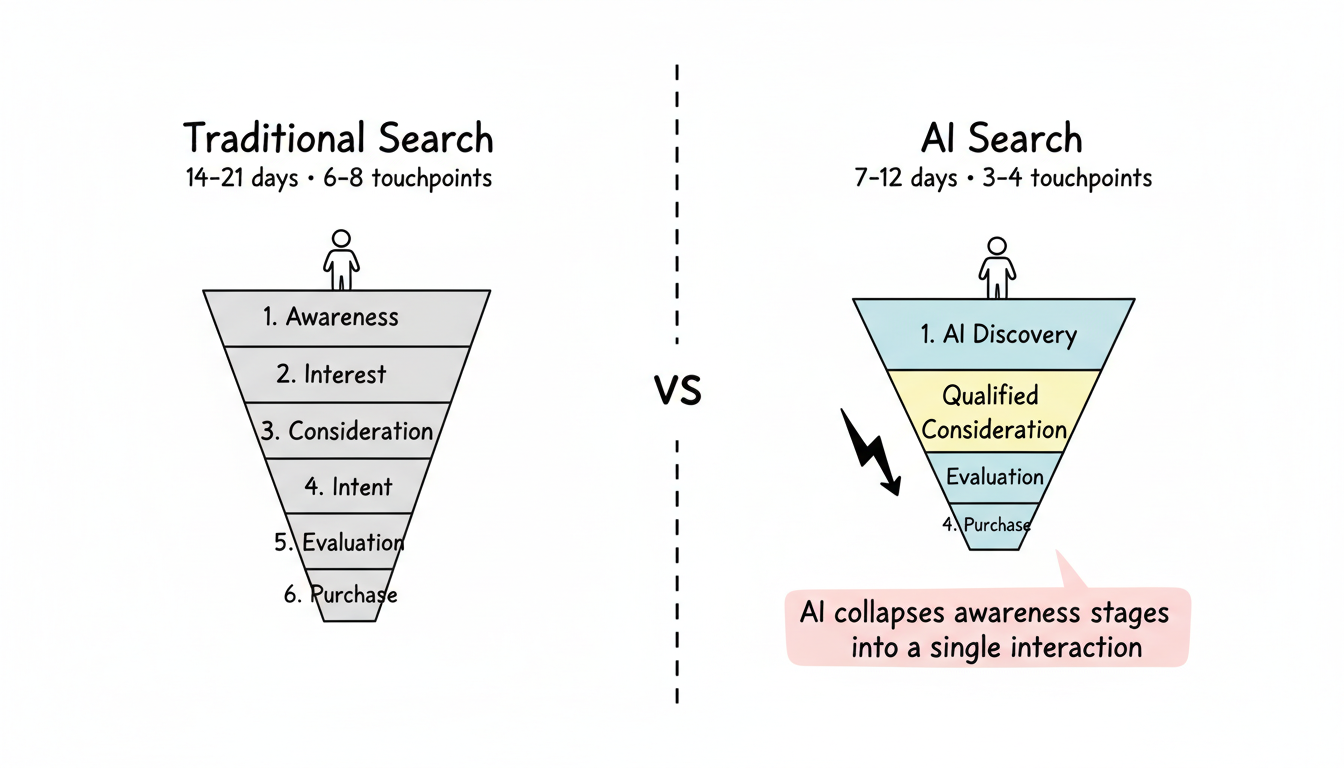
The Compressed Funnel
Traditional funnel:
Awareness -> Interest -> Consideration -> Intent -> Evaluation -> Purchase
(6-8 touchpoints average, 14-21 days B2B)
AI-mediated funnel:
AI Discovery -> Qualified Consideration -> Evaluation -> Purchase
(3-4 touchpoints average, 7-12 days B2B)
AI collapses awareness and interest stages into a single AI interaction. Visitors arriving at your site have already progressed further.
Funnel Stage Conversion Analysis
Stage-by-stage conversion rates:
Funnel Stage | Pre-AI | Post-AI | Change |
Awareness -> Interest | 15% | N/A (AI-collapsed) | - |
Interest -> Consideration | 22% | N/A (AI-collapsed) | - |
AI Discovery -> Consideration | N/A | 45% | New |
Consideration -> Intent | 28% | 38% | +36% |
Intent -> Evaluation | 52% | 61% | +17% |
Evaluation -> Purchase | 34% | 41% | +21% |
Each measurable stage shows improved conversion. The "lost" stages happen within AI interactions, not on your site. Implementing FAQ schema for AI Overviews can help capture users at the compressed consideration stage.
Attribution Implications
Compressed funnels require attribution model updates:
Recommended adjustments:
Attribution Element | Traditional Approach | AI-Adjusted Approach |
First-touch credit | 40% | 25% |
AI interaction credit | 0% | 30% |
Last-touch credit | 40% | 35% |
Assist interactions | 20% | 10% |
Recognize AI as a channel deserving attribution, even when direct tracking isn't possible.
Case Study: Full-Funnel Impact Analysis
B2B SaaS Company Analysis
Company profile:
- Product: Marketing automation platform
- Previous organic traffic: 45,000 monthly visits
- Target conversion: Demo request
12-month impact analysis:
Metric | Month 1 | Month 12 | Change |
Organic traffic | 45,000 | 31,500 | -30% |
AI referral traffic | 0 | 4,200 | +New |
Total traffic | 45,000 | 35,700 | -21% |
Organic CVR | 1.8% | 2.9% | +61% |
AI CVR | N/A | 5.4% | New |
Demo requests | 810 | 1,141 | +41% |
SQL rate | 28% | 34% | +21% |
Closed revenue | $2.4M | $3.1M | +29% |
Despite 21% traffic decline, revenue increased 29% through improved conversion and lead quality. This company leveraged tactics from the Google AI Overviews optimization playbook to maximize their visibility.
E-Commerce Retailer Analysis
Company profile:
- Category: Home goods
- Previous organic traffic: 280,000 monthly visits
- Target conversion: Purchase
6-month impact analysis:
Metric | Pre-AI | Post-AI | Change |
Organic traffic | 280,000 | 195,000 | -30% |
AI-adjacent traffic | N/A | 42,000 | +New |
CVR (organic) | 2.1% | 2.8% | +33% |
CVR (AI) | N/A | 4.1% | New |
Transactions | 5,880 | 7,182 | +22% |
AOV | $85 | $94 | +11% |
Revenue | $499,800 | $675,108 | +35% |
Higher-intent visitors produced more transactions at higher order values. Their success relied on schema markup alignment with visible content to maintain consistency across AI and traditional search.
Industry Benchmarks: AI Overview Impact Across Verticals
Industry-level patterns help teams benchmark their own AI Overview impact against peers. One notable development: Google Ads now appear alongside AI Overviews on approximately 25% of commercial SERPs, up from less than 1% at the original SGE launch. For conversion-focused teams, this creates a dual-channel opportunity where organic citation in the AI Overview plus a paid Google Ads campaign management placement on the same SERP can compound click-through and conversion rates. Early data suggests that SERPs where a brand appears in both the AI Overview citation and a paid ad see 35-45% higher combined CTR than either channel alone.
Measurement Implementation Guide
Required Tracking Setup
Essential tracking elements:
Component | Purpose | Implementation |
AI source tagging | Identify AI referrals | UTM parameters, referrer parsing |
Query-level AI status | Connect queries to AI presence | SERP monitoring tools |
Enhanced ecommerce | Track full purchase journey | GA4 enhanced measurement |
CRM integration | Connect leads to revenue | CRM + GA4 data import |
Attribution modeling | Credit distribution | GA4 data-driven attribution |
Google Search Console serves as the primary data source for impression, click, and CTR data when measuring AI Overview impact. GSC's Search Appearance filter can isolate AI Overview impressions where available, providing a direct view into how AI-mediated queries are performing for your domain. Pair GSC data with your analytics platform to connect impression-level data to on-site conversion outcomes.
Organizations comparing the best generative engine optimization platforms for AI search results should prioritize platforms with robust attribution capabilities.
Reporting Framework
Monthly AI impact report template:
AI Search Impact Report - [Month]

1. Traffic Composition
   - Total organic: [number]
   - AI referral: [number] ([% of total])
   - AI-affected organic: [number]
   - Traditional organic: [number]

2. Conversion Performance
   - Overall CVR: [%]
   - AI traffic CVR: [%]
   - Traditional CVR: [%]
   - Conversion lift from AI: [%]

3. Revenue Attribution
   - Total attributed revenue: $[amount]
   - AI-attributed revenue: $[amount]
   - Revenue per AI visitor: $[amount]
   - Revenue per traditional visitor: $[amount]

4. Trend Analysis
   - Traffic trend: [improving/declining]
   - CVR trend: [improving/declining]
   - Revenue trend: [improving/declining]
   - Net business impact: [positive/negative/neutral]
In addition to the metrics above, two emerging KPIs should be tracked in every AI impact report: Citation frequency—the percentage of target keyword SERPs where your domain appears as a cited source within AI Overviews—and Share of voice—the percentage of relevant SERPs where your brand appears in any capacity (organic result, AI Overview citation, featured snippet, or People Also Ask). These two metrics, tracked alongside conversion data, form the complete measurement framework for AI-era reporting.
Data-driven prioritization:
Finding | Indicated Action | Priority |
High AI CVR, low volume | Increase AI visibility investment | High |
Low AI CVR despite volume | Improve landing page experience | High |
Traffic declining, CVR stable | Focus on AI citation strategy | Medium |
Revenue stable despite traffic drop | Maintain current approach | Low |
Teams can consult the AEO terminology glossary to ensure consistent communication around optimization priorities.
Share of Voice: The Post-AIO Visibility Metric
Traditional rank tracking was designed for a SERP with ten blue links. In the AI Overview era, share of voice provides a more complete picture of search visibility. Share of voice measures the percentage of relevant SERPs where your brand appears in any capacity—organic result, AI Overview citation, featured snippet, People Also Ask, or knowledge panel. It captures total SERP presence rather than a single positional metric.
This distinction matters because traditional rank tracking misses AI Overview citations entirely. A domain can rank position 6 organically but appear as a primary cited source in the AI Overview, earning more visibility and higher-quality clicks than the position-1 result. Without share of voice tracking, this visibility is invisible to your reporting.
The historical connection to featured snippets is instructive. Featured snippets were the first "position zero" disruption, and many strategies for earning featured snippets—concise direct answers, structured data markup, list and table formats—also increase AI Overview citation likelihood. Teams already optimizing for featured snippets have a head start on AI Overview visibility. For a deeper dive on this relationship, see our guide on SEO measurement framework best practices.
The recommended two-metric framework for AIO-era reporting combines share of voice (total SERP visibility) with conversion metrics (business outcome). Together, these metrics answer the two questions that matter: "Are we visible?" and "Is that visibility driving revenue?"
Key Takeaways
Analyze AI Overview impact through a conversion lens:
- Traffic decline isn't revenue decline - Conversion rate improvements frequently offset volume losses
- AI traffic converts better - 2x average conversion rates across industries
- Lead quality improves - Higher MQL/SQL rates, larger deal sizes
- Funnels compress - Fewer touchpoints, faster journeys, higher per-stage conversion
- Attribution must evolve - Credit AI influence even without direct tracking
- Revenue per visitor matters most - Focus on value, not just volume
- Measurement enables optimization - Implement tracking before drawing conclusions
The businesses thriving in AI search measure what matters—revenue and conversions, not just clicks. Traffic decline headlines mask the more nuanced reality: AI Overviews can improve business outcomes even as they reduce traffic volume. Understanding AI Overview vs featured snippets performance differences helps businesses allocate optimization resources effectively.
Implement conversion tracking, segment AI-influenced traffic, and let data guide your strategy rather than headline statistics. For ongoing optimization, consider working with a generative engine optimization agency or exploring best AEO services to maximize your AI search performance.
Frequently Asked Questions
How Much Does an AI Overview Reduce Click-Through Rates?
Studies show AI Overviews reduce organic CTR by 35-60% on affected queries. Ahrefs found a 34.5% average reduction, while Seer Interactive reported up to 61% decline across 25.1 million impressions. The impact varies by query type—informational queries see the steepest drops, while navigational and transactional queries are less affected. However, clicks that do come through tend to carry higher conversion intent because the AI Overview pre-filters casual browsers.
What Is Citation Frequency and Why Does It Matter for AI Overviews?
Citation frequency measures how often your domain appears as a cited source within AI Overviews for your target keywords. It is becoming a critical KPI because being cited drives qualified traffic—users who click a cited link have already seen the AI's summary and are seeking deeper information. Track citation frequency alongside traditional rank and CTR in Google Search Console to get a complete picture of your SERP visibility.
Do AI Overviews Affect Conversions or Just Traffic?
AI Overviews compress the marketing funnel by answering surface-level questions directly in the SERP. This reduces top-of-funnel traffic volume but the visitors who do click through tend to be further along in their decision process. Our analysis shows that while page sessions may decline, conversion rates often improve because the remaining traffic is higher-intent. The net revenue impact depends on your industry and funnel structure.
How Should I Adjust My SEO Strategy for AI Overviews in 2026?
Focus on three pillars: build E-E-A-T signals (original research, expert authorship, strong backlink profile) to increase your citation likelihood; track share of voice across all SERP features rather than rank alone; and segment your keyword portfolio by query type to prioritize high-conversion terms that are less affected by AI Overviews. Pair organic efforts with Google Ads on commercial queries where AI Overviews appear alongside paid placements.