
Traditional SEO dashboards fail to capture the metrics that matter in AI search. Citation frequency, LLM referral traffic, and brand mention sentiment require new measurement approaches that most analytics platforms don't natively support. Designing an effective AI search analytics dashboard means identifying which metrics to track, how to collect them, and how to visualize insights that drive optimization decisions.
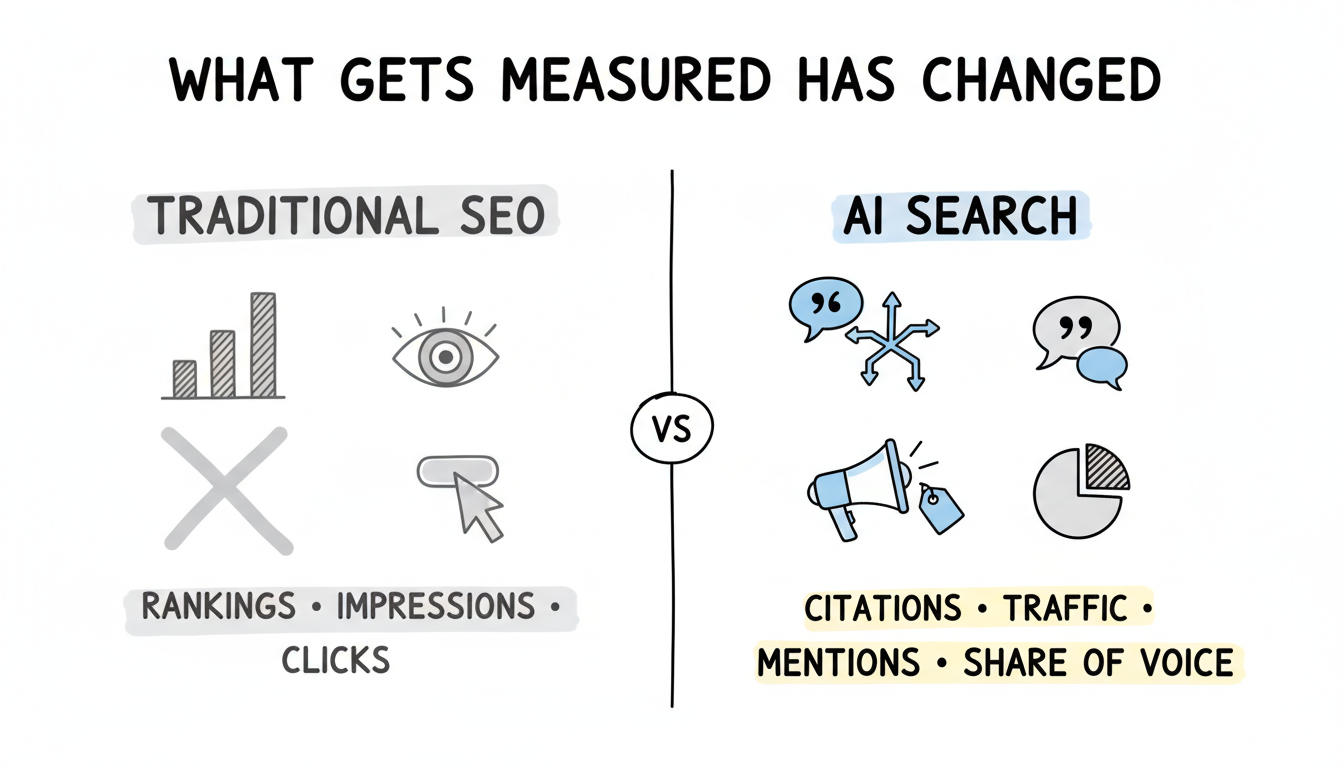
The Measurement Challenge
AI search visibility operates differently than traditional organic search, requiring evolved measurement frameworks.
Why traditional dashboards fall short: Standard SEO dashboards track rankings, impressions, and clicks—metrics that don't translate directly to AI search performance. When ChatGPT cites your content, no traditional ranking exists. When Perplexity references your page, the citation context matters as much as the citation itself. Traditional tools weren't built for this reality.
The new measurement requirements:
- Citation tracking across multiple AI platforms
- Referral traffic attribution from AI sources
- Brand mention monitoring in LLM responses
- Share of voice in AI-generated answers
- Content extraction and synthesis patterns
Research indicates that ChatGPT drives 89% of measured AI referral traffic to websites, while Perplexity shows 6.2x higher referral efficiency—meaning Perplexity users click through to cited sources at dramatically higher rates. These platform-specific patterns require dashboard designs that capture nuance rather than aggregate everything into single metrics.
Understanding the distinction between AEO and GEO is critical for dashboard design. Answer Engine Optimization (AEO) focuses on optimizing content to appear in answer engines such as featured snippets, AI Overviews, and voice assistants. Generative Engine Optimization (GEO) targets generative AI output specifically—the free-form citations and brand references produced by ChatGPT, Perplexity, and Gemini. An effective AI search analytics dashboard must measure both dimensions, since AEO and GEO have fundamentally different citation mechanics, ranking signals, and optimization levers. Organizations pursuing advanced GEO optimization strategies will find that dashboard requirements differ significantly from traditional AEO tracking.
Core Dashboard Components
An effective AI search dashboard integrates four metric categories.
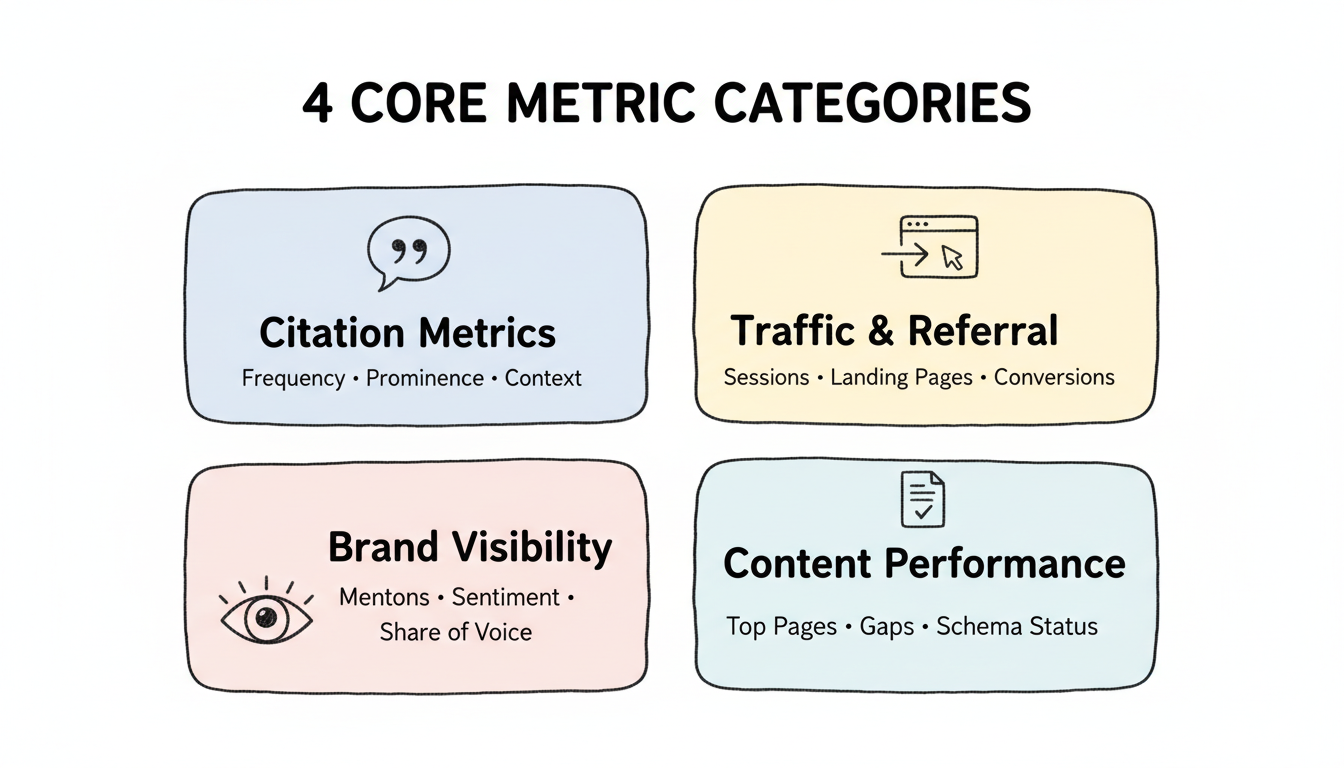
1. Citation Metrics
Track how often and where AI platforms reference your content.
Key citation metrics:
- Citation frequency by platform (ChatGPT, Perplexity, Google AI Overviews, Copilot)
- Citation prominence (primary source vs. supplementary reference)
- Citation context (positive, neutral, comparative mentions)
- Topic coverage breadth (which queries trigger citations)
- Citation share versus competitors
Platform-specific tracking: Different platforms require different monitoring approaches. Google AI Overviews citations can be tracked through Search Console with AI Overview filters. ChatGPT and Perplexity citations require specialized monitoring tools or API access for systematic tracking. Understanding Google AI Overview international and regional variations helps contextualize citation patterns across different markets.
2. Traffic and Referral Metrics
Measure actual visits from AI search sources.
Traffic metrics:
- Referral sessions from identified AI platforms
- Landing page performance by AI source
- Bounce rate and engagement by referral source
- Conversion rates from AI traffic
- Session duration comparisons across sources
Attribution challenges: Not all AI referral traffic identifies itself clearly. Some ChatGPT traffic appears as direct visits. Implement UTM parameters where possible and use referral source analysis to estimate unattributed AI traffic.
3. Brand Visibility Metrics
Monitor brand mentions in AI responses beyond direct citations.
Brand metrics:
- Brand mention frequency in target topic responses
- Sentiment of brand mentions (positive, neutral, negative)
- Competitor mention comparison
- Brand association accuracy (correct information vs. errors)
- Brand visibility trends over time
Share of voice calculation: Measure what percentage of AI responses for your target topics mention your brand versus competitors. This share of voice metric indicates relative visibility in the AI search landscape. Comprehensive AEO marketing audits often reveal gaps between perceived brand authority and actual AI search visibility.
4. Content Performance Metrics
Understand which content earns AI visibility.
Content metrics:
- Top-cited pages and content types
- Content characteristics correlating with citations (word count, structure, freshness)
- Gap analysis showing topics where competitors earn citations but you don't
- Content update impact on citation frequency
- Schema markup implementation and validation status
Structured data like FAQ schema and HowTo schema can significantly improve AI platform citation rates when properly implemented.
Real-Time Monitoring and Automated Alerts
Beyond periodic reporting, configure real-time alerts to catch critical changes before they compound. Effective dashboards include automated triggers for: citation volume dropping below a defined threshold, new competitor citations detected in your target queries, sentiment shifts in brand mentions turning negative, and referral traffic anomalies from AI sources exceeding normal variance. Set up webhook integrations with Slack or email for immediate notification when alerts fire. Tools like Profound and Peec AI support real-time monitoring pipelines, and pairing these with an AEO analytics setup guide ensures your alert infrastructure covers both AEO and GEO dimensions from the start.
Prompt-Level Tracking and Multi-Model Filtering
Traditional keyword tracking monitors broad topics, but AI search requires tracking specific prompt formulations. The difference matters: "best project management tools for remote teams" and "project management software" may trigger entirely different citation sets across AI platforms. Prompt-level tracking captures these variations by tagging prompts by persona, funnel stage, and intent category—giving your dashboard granular visibility into which exact queries drive AI citations for your content.
Multi-model filtering is equally essential. Each AI platform cites sources differently, and segmenting analytics by model reveals patterns that aggregated views hide. ChatGPT tends to use inline brand mentions and occasionally links, Perplexity provides footnoted source links with high click-through rates, Gemini integrates citations contextually within longer responses, and DeepSeek and Copilot each have distinct referencing behaviors. A dashboard that filters by model enables platform-specific optimization rather than one-size-fits-all strategies.
When evaluating AI citation tracking tools for prompt-level monitoring, platforms like Peec AI and Otterly.AI offer prompt-based tracking capabilities that allow you to define prompt libraries organized by topic cluster and track citation performance at the individual prompt level. Daily cadence tracking is the recommended best practice—AI model outputs can shift significantly within short windows as models update their knowledge bases and retrieval pipelines. Building prompt-level tracking into your ai search analytics dashboard transforms it from a retrospective reporting tool into a proactive optimization engine.
Predictive Analytics and Citation Forecasting
Most AI search dashboards stop at descriptive analytics—showing what happened. The competitive advantage lies in predictive capabilities that forecast what will happen to your citation visibility. Moving from descriptive to predictive transforms your seo analytics dashboard from a rearview mirror into a forward-looking strategic tool.
Three forecasting approaches deliver the most value for ai search analytics. First, citation trend extrapolation uses historical citation frequency data to project future share of voice using rolling 30/60/90-day windows. Second, seasonal pattern analysis identifies cyclical query volume fluctuations—B2B software queries spike in Q1 budget planning cycles, while consumer topics follow different rhythms. Third, competitive displacement modeling detects when new entrants or competitor content updates threaten your citation positions before the impact fully materializes.
Machine learning models that monitor early signals of citation loss provide the highest-leverage insights. Content freshness decay, competitor content publication velocity, and changes in AI model retrieval behavior all serve as leading indicators. For example, if citation frequency for a key topic drops 15% week-over-week, the dashboard should trigger automated alerts and surface content refresh priorities ranked by potential citation recovery value. Connecting these predictive signals to the AEO metrics and KPIs your team already tracks ensures forecasts translate directly into actionable optimization decisions rather than abstract projections.
Cross-Channel Attribution for AI Search
Standard last-click attribution fails for AI search because the user journey often spans invisible touchpoints. A prospect may encounter your brand cited in ChatGPT, later search your company name directly on Google, and convert through an organic click—creating an AI-assisted conversion that attribution models credit entirely to organic search. Without accounting for AI citation touchpoints, dashboards systematically undervalue AI search investments.
Three attribution models are suited for AI search visibility. AI-assisted first-touch attribution credits the initial AI citation exposure as the originating touchpoint, even when the converting session arrives through a different channel. Multi-touch attribution with AI citation weighting assigns fractional credit to AI citation appearances alongside traditional touchpoints based on their proximity to conversion events. Incrementality testing for AI visibility measures the causal lift in conversions correlated with periods of increased AI citation frequency, isolating the AI channel's true contribution.
Connect AI citation data with GA4 conversion events using UTM parameters for platforms that support referral links and referral source segmentation for those that don't. The persistent challenge is "dark traffic"—AI-influenced visits that appear as direct traffic because users saw your brand in an AI response and then navigated directly to your site. Time-series correlation analysis between citation volume changes and direct traffic fluctuations provides directional attribution estimates. Mapping citation appearances to downstream conversion paths reveals revenue attribution insights that justify AI search optimization budgets. Understanding which AI search ranking factors drive citations helps refine attribution models by weighting touchpoints based on the strength of the underlying ranking signals.
Dashboard Architecture
Structure your dashboard for actionable insights rather than data overload.
Executive summary view: Present high-level KPIs at the top: total citations across platforms, AI referral traffic, citation share versus competitors, and month-over-month trends. This summary lets stakeholders quickly assess overall AI search health.
Platform-specific sections: Create dedicated views for each major platform. Google AI Overviews performance differs significantly from ChatGPT visibility, which differs from Perplexity citation patterns. Platform sections enable targeted optimization decisions.
Trend analysis: AI search visibility fluctuates significantly—research shows 40-60% of domains cited for any given query change within one month. Trend visualization helps distinguish signal from noise and identifies patterns requiring action. Tracking content freshness signals becomes critical for understanding citation volatility.
Competitive comparison: Include competitor benchmarking throughout the dashboard. Your citation frequency means little without context about competitor performance on the same queries.
Data Collection Methods
Multiple data sources feed a comprehensive AI search dashboard.
Native platform data:
- Google Search Console (AI Overview impressions and clicks)
- Google Analytics 4 (referral traffic segmentation)
- Server logs (detailed referral analysis)
Third-party monitoring tools: Several platforms now offer AI citation monitoring: Profound (recognized as a leader in AEO analytics for 2026), Otterly.AI, and LLMrefs provide citation tracking across platforms. BrightEdge, Ahrefs, and Semrush have added AI search features to their suites. When evaluating these ai analytics tools, prioritize those offering multi-model filtering—the ability to segment citation data by AI platform (ChatGPT, Gemini, Perplexity, DeepSeek) is essential for platform-specific optimization and prevents aggregated metrics from masking model-specific performance variations.
Custom monitoring: For comprehensive coverage, many organizations implement custom monitoring through AI platform APIs or systematic response sampling. Custom approaches capture nuances that third-party tools may miss.
Data integration: Use a data warehouse or integration platform to combine sources into a unified dashboard. Looker Studio, Tableau, or dedicated SEO reporting platforms can aggregate disparate data sources.
Visualization Best Practices
Effective visualization transforms data into decisions.
Time-series charts: Plot citation frequency and traffic over time. Use consistent date ranges across metrics for trend comparison. Include benchmark lines showing competitor performance or industry averages.
Platform comparison charts: Side-by-side platform performance visualization helps identify where optimization efforts should focus. Bar charts comparing citation frequency by platform reveal relative strengths and weaknesses.
Topic heatmaps: Visualize citation performance across topic categories using heatmaps. This reveals which content areas earn strong AI visibility and where gaps exist.
Alert thresholds: Set visual thresholds that highlight concerning changes. Significant citation drops or traffic declines should stand out immediately rather than hiding in dense data tables.
Privacy-compliant tracking: AI search analytics must comply with GDPR and CCPA when tracking referral traffic from AI platforms. Implement cookieless tracking approaches for AI referral attribution by leveraging server-side analytics—which inherently avoids client-side privacy issues—and first-party data strategies. Server log analysis, already a core data collection method for AI referral tracking, provides privacy-compliant attribution without relying on third-party cookies or client-side tracking scripts.
Reporting Cadence and Stakeholders
Different stakeholders need different views and frequencies.
Executive reporting (monthly): High-level KPIs, strategic trends, competitive positioning. Focus on business impact rather than tactical details. Answer: "How is our AI search visibility affecting business goals?"
Marketing team reporting (weekly): Platform-specific performance, content performance, optimization opportunities. Enable tactical decisions about content updates and prioritization.
Technical team reporting (continuous): Schema validation status, crawl accessibility, structured data errors. Technical issues require immediate visibility for quick resolution.
Cross-functional alignment: AI search visibility involves content, technical, and brand teams. Dashboard design should facilitate cross-functional discussions rather than siloing data by department.
Common Dashboard Mistakes
Avoid these frequent errors in AI search dashboard design.
Vanity metric focus: Citation counts without context mislead. A hundred citations in irrelevant contexts matter less than ten citations for high-intent commercial queries. Weight metrics by business impact.
Platform aggregation: Combining all AI platforms into single metrics obscures platform-specific patterns. What works for Google AI Overviews may fail for ChatGPT. Maintain platform granularity.
Ignoring competitive context: Absolute metrics without competitive benchmarks provide false confidence. Your citations may be increasing while competitors' grow faster. Always include competitive comparison.
Static dashboards: AI search evolves rapidly. Dashboards designed for 2025's landscape may miss 2026's important metrics. Build flexible architectures that accommodate new platforms and metrics.
Insufficient historical depth: Short time windows hide meaningful trends. Maintain at least 12 months of historical data to distinguish seasonal patterns from actual performance changes.
Optimization Strategies
Build your dashboard incrementally rather than attempting comprehensive coverage immediately.
Phase 1: Foundation Start with available data: Search Console AI Overview metrics, referral traffic segmentation, and manual citation sampling. This foundation provides immediate value while more sophisticated tracking develops.
Phase 2: Expansion Add third-party monitoring tools for broader citation coverage. Implement competitive tracking and brand mention monitoring. Expand to additional platforms as tools mature.
Phase 3: Optimization Build custom integrations for unique measurement needs. Develop attribution models for AI-influenced conversions. Create predictive indicators for citation likelihood.
Building Citations Through Digital PR and Review Platforms
AI models pull citations from authoritative third-party sources, not just your own site. Three tactical channels consistently build the kind of authority signals that drive AI citations. First, presence on review platforms like G2, Capterra, and TrustRadius creates structured endorsement data that LLMs index as authority signals—these reviews surface in AI responses when users ask for product comparisons and recommendations. Second, active participation in Reddit and LinkedIn discussions where your team demonstrates domain expertise builds the kind of authentic brand mentions that generative models reference. Third, digital PR placements on industry publications provide the editorial authority signals that AI models weight heavily when selecting citation sources.
This practice falls under Generative Engine Optimization (GEO)—optimizing specifically for generative AI output, which differs from AEO's broader focus on answer engines. Your dashboard should track third-party citation sources alongside direct citations, segmenting by platform to identify which channels drive the most AI visibility. Implementing structured data for AI search across both your own properties and third-party profiles strengthens citation signals across all channels.
FAQs
What Tools Should We Use for AI Search Dashboards?
Start with Google Search Console and Google Analytics 4 for foundational data. Add specialized tools like Profound, Otterly.AI, or platform features from Semrush and Ahrefs for citation monitoring. Use Looker Studio or similar visualization platforms to integrate sources into unified dashboards.
How Often Should We Review AI Search Analytics?
Weekly tactical reviews identify emerging issues and optimization opportunities. Monthly strategic reviews assess trends and competitive position. Daily monitoring for high-priority alerts catches critical issues quickly. Balance review frequency against resource availability and business impact.
What'S the Most Important AI Search Metric to Track?
No single metric captures AI search performance comprehensively. Citation frequency indicates visibility, but referral traffic measures actual impact. Share of voice shows competitive position. The most important metric depends on business goals—brand awareness programs prioritize mentions, while lead generation focuses on referral conversions.
How Do You Track Which AI Models Cite Your Content?
Use prompt-level tracking tools that monitor citations across ChatGPT, Perplexity, Gemini, and DeepSeek simultaneously. API-based monitoring provides systematic coverage, while manual prompt testing validates automated results. Each model has different citation behaviors—ChatGPT uses inline mentions, Perplexity provides footnoted links, and Gemini integrates citations contextually—so your dashboard needs model-specific views rather than a single aggregated citation count.
What Is the Difference Between AEO and GEO?
Answer Engine Optimization (AEO) focuses on optimizing content to appear in answer engines including featured snippets, AI Overviews, and voice assistants. Generative Engine Optimization (GEO) targets generative AI output specifically—the free-form responses produced by ChatGPT, Perplexity, and Gemini. Dashboards should track both, since AEO metrics focus on structured answer placements while GEO metrics track free-form AI citations and brand mentions across conversational interfaces.
Can AI Search Analytics Dashboards Forecast Citation Trends?
Yes. Advanced dashboards use historical citation data, seasonal query patterns, and competitive movement signals to project future citation share of voice through rolling 30/60/90-day forecasts. Early warning indicators—such as content freshness decay and competitor publication velocity—flag citation risk before losses materialize. Predictive capabilities are what separate basic monitoring dashboards from actionable intelligence platforms that drive proactive optimization.
How Do You Attribute Conversions to AI Search Visibility?
AI-influenced visits often appear as direct traffic because users see your brand in an AI response and navigate to your site without a trackable referral. Multi-touch attribution models that weight AI citation touchpoints, UTM-based referral tracking from platforms that support links, and incrementality testing all provide attribution signals. Correlating citation volume changes with conversion rate changes over time provides directional attribution even without perfect per-session tracking.