
Understanding Facebook ad costs helps you set realistic budgets and benchmark your campaign performance. But "average" costs vary significantly based on your industry, objectives, and targeting.
This guide breaks down the latest 2026 Facebook advertising costs by metric type, industry, and recent trends to help you plan your ad spend effectively.
Average Costs Overview
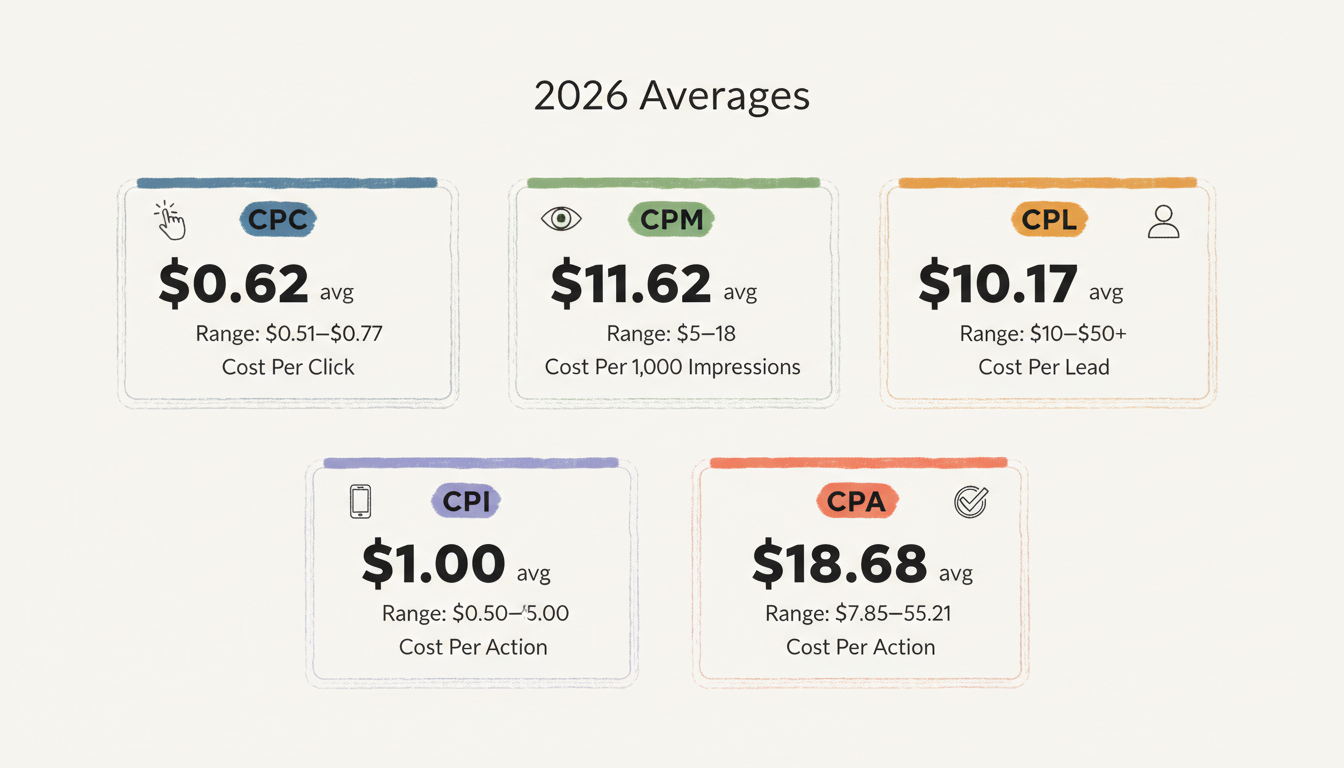
Facebook ads operate on an auction system where costs fluctuate based on competition, audience, and ad quality. Here are the current averages for 2026:
Metric | Average Cost | Typical Range |
Cost Per Click (CPC) | $0.62 | $0.51 - $0.77 |
Cost Per 1,000 Impressions (CPM) | $11.62 | $5 - $18 |
Cost Per Lead (CPL) | $10.17 | $10 - $50+ |
Cost Per Install (CPI) | $1.00 | $0.50 - $5.00 |
Cost Per Action (CPA) | $18.68 | $7.85 - $55.21 |
These averages are compiled from millions of ad impressions across industries. Your actual costs will depend on factors like audience targeting, industry competitiveness, and creative quality.
What Influences Your Costs
Several factors push costs above or below these averages:
- Audience targeting: Narrow, competitive audiences cost more
- Industry competition: High-value industries like finance and insurance face premium pricing
- Ad quality: Higher relevance scores can reduce costs
- Bidding strategy: Manual vs. automatic bidding affects outcomes
- Seasonality: Q4 typically sees 15-20% higher costs
By Metric Type
Understanding each cost metric helps you choose the right one to optimize.
Cost per Click (CPC)
CPC measures what you pay when someone clicks your ad. According to December 2025 benchmarks, the median CPC across industries is $0.57.
When CPC matters:
- Driving website traffic
- Building landing page views
- Testing ad creative engagement
CPC by vertical:
- E-commerce: $1.07 (roughly 5% below average)
- Lead generation: $1.92 (higher due to qualified traffic value)
Understanding facebook ads cost per click patterns can help you identify optimization opportunities and benchmark your performance against industry standards.
Cost per Mille (CPM)
CPM reflects the cost per 1,000 impressions. U.S. averages for 2025 show:
- Annual average: $22.20
- Lowest point: $17.12 (January 2026)
- Highest point: $28.09 (November 2025)
The U.S. commands approximately 12% higher CPMs than global averages, reflecting the premium nature of American audiences.
When CPM matters:
- Brand awareness campaigns
- Reach-focused objectives
- Video view campaigns
Cost per Lead (CPL)
CPL measures lead acquisition cost. The average CPL is $27.66 for lead-focused campaigns, but this varies dramatically by industry:
- B2B leads: Often exceed $100
- Consumer services: Can stay below $20
- Real estate: $16.92
- Education: $7.85
Cost per Action (CPA)
CPA tracks the cost of completed conversions. Purchase-driven campaigns average between $35-$55 depending on product value.
CPA benchmarks:
- E-commerce/subscription: $35-$55
- Lead generation: $27.66
- App installs: $1.00
By Industry
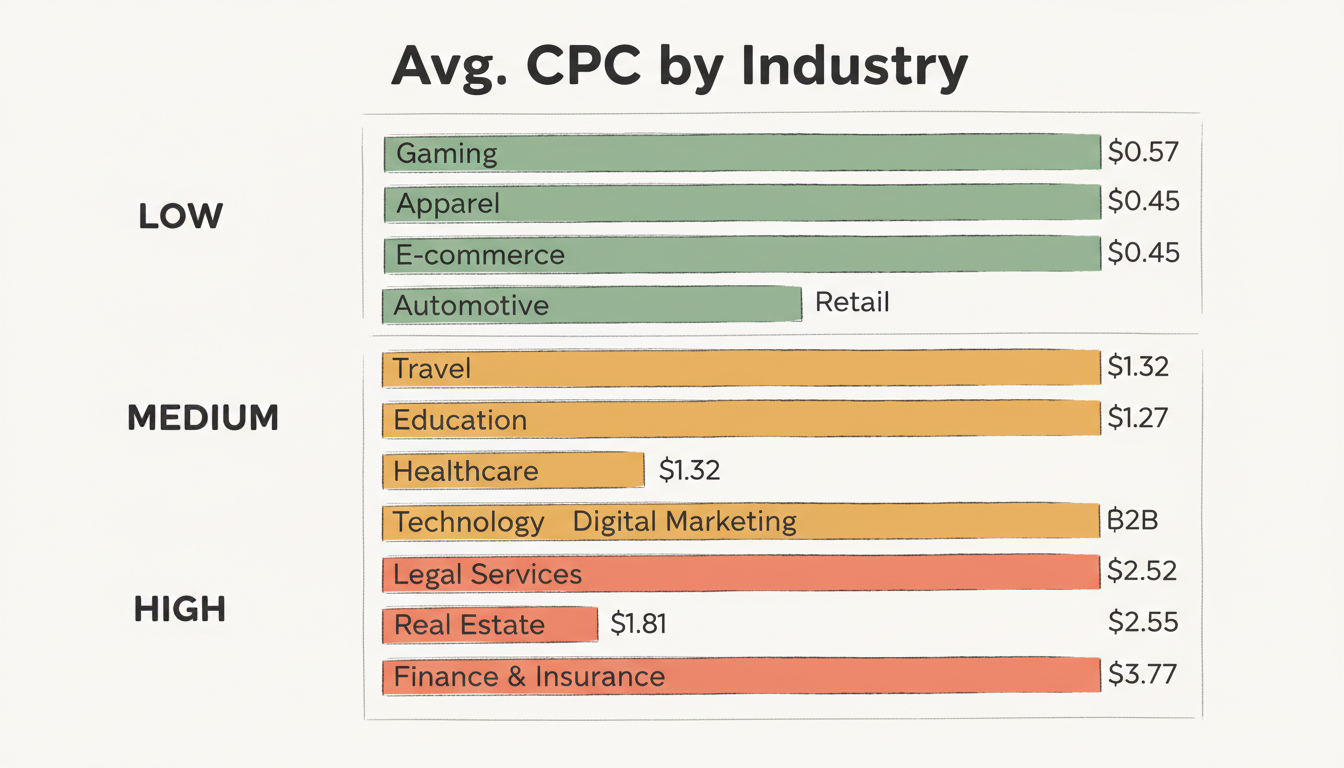
Your industry heavily influences Facebook ad costs. Here are 2026 industry benchmarks:
Low-Cost Industries
Industry | Avg. CPC | Avg. CPM | Avg. CPA |
Retail | $0.70 | $1.38 | $21.47 |
E-commerce | $0.45 | $5.33 | $45.00 |
Apparel | $0.45 | $5.99 | $10.98 |
Automotive | $0.45 | $6.81 | $43.84 |
Gaming | $0.57 | $8.90 | $29.00 |
Medium-Cost Industries
Industry | Avg. CPC | Avg. CPM | Avg. CPA |
Education | $1.06 | $5.31 | $7.85 |
Healthcare | $1.32 | $5.78 | $12.31 |
Digital Marketing | $1.38 | $7.19 | $23.10 |
Technology | $1.27 | $9.98 | $55.21 |
Travel & Tourism | $0.63 | $9.89 | $22.50 |
High-Cost Industries
Industry | Avg. CPC | Avg. CPM | Avg. CPA |
Legal Services | $1.81 | $11.31 | $28.70 |
Real Estate | $1.81 | $10.97 | $16.92 |
B2B | $2.52 | $22.50 | $23.77 |
Fintech | $2.55 | $19.35 | $40.00 |
Finance & Insurance | $3.77 | $11.37 | $41.43 |
Industry Trends
Recent data from Emplifi shows diverging trends:
- Retail CPCs: Nearly doubled from $0.16 in Q3 2024 to $0.32 in Q3 2025
- E-commerce CPCs: Fell from $0.23 to $0.19 in the same period
The difference? E-commerce campaigns have clearer online conversion signals, allowing Meta's AI to optimize more efficiently. Retail advertisers with mixed online/offline goals see less optimization benefit. For e-commerce advertisers looking to maximize efficiency, implementing an ecommerce meta ads strategy tailored to your conversion signals is essential.
Cost Trends
Understanding historical patterns helps you plan budgets and anticipate fluctuations.
Seasonal Patterns
Facebook ad costs follow predictable seasonal cycles. According to benchmark data:
- Q1: Lowest costs (post-holiday reset)
- Q2: Moderate costs (gradual increase)
- Q3: Building toward Q4
- Q4: Peak costs (15-25% above annual average)
The Q4 2025 average CPM was $25.49 - about 22% higher than Q1's $20.96.
Monthly Variations (2025)
Month | U.S. CPM | Change from Start |
January 2025 | $20.41 | Baseline |
March 2025 | $21.95 | +7.5% |
June 2025 | $22.10 | +8.3% |
September 2025 | $22.10 | +8.3% |
November 2025 | $28.09 | +38% (Peak) |
January 2026 | $17.12 | -16% |
Year-Over-Year Changes
Facebook ad costs have generally increased over time, though AI-driven optimization is creating efficiency gains for some advertisers.
Key trends:
- CPCs rising 7-18% year-over-year across most industries
- AI optimization reducing costs for advertisers with clear conversion signals
- Premium audiences (high-income, professional) commanding increasing premiums
Typical Monthly Budgets
For context on what businesses actually spend, agency reporting shows:
Business Type | Typical Monthly Spend |
Small business average | $2,000 - $5,000 |
Competitive markets | $3,000+ |
Testing/learning phase | $1,000 minimum |
Median across industries | $1,051.86 |
Campaigns under $1,000/month often struggle to generate meaningful data for optimization. When planning your budget, factor in enough spend to reach statistical significance for your conversion goals. Understanding whether do facebook ads cost money fits your business model is an important first step in budget planning.
Industry-Specific Budgets
Monthly spend varies significantly by sector:
- Apparel & Fashion: $3,565.68 median
- Cleaning Services: $618.44 median
This reflects both market competitiveness and customer acquisition costs in each industry. Working with a specialized facebook ads management agency can help optimize spending patterns within your industry's typical range.
How to Use These Benchmarks
If Your Costs Are Higher Than Average
- Review audience targeting (may be too narrow or competitive)
- Audit ad creative quality and relevance
- Check if meta ads bidding strategy aligns with objectives
- Consider whether your industry naturally runs higher
If Your Costs Are Lower Than Average
- Validate tracking is capturing all conversions
- Confirm you're reaching the right audience quality
- Consider scaling budget to capture more volume
- Monitor for audience fatigue over time
Setting Realistic Expectations
Don't compare your B2B software campaign to e-commerce benchmarks. Instead:
- Find your specific industry average
- Track your own historical performance
- Benchmark against competitors when possible
- Allow 2-4 weeks for campaigns to optimize before judging costs
Understanding these benchmarks allows you to set realistic expectations and make informed decisions about your advertising investment across Meta's platforms.
Your cost per result depends heavily on who you target. Refine your audiences with our Facebook ad targeting guide, which covers custom and lookalike audiences and how to avoid overlap.
How to Use These Benchmarks Without Fooling Yourself
Benchmarks are averages, and averages hide the case that matters to you. Read the cost by your industry and your objective, not the blended number, because a low overall CPM can sit beside a CPC that is wrong for your business. The segment, not the headline, is the useful figure.
Compare against your own trend, not just the market. A cost that rose ten percent may be normal for the quarter, while a cost that fell against a rising market is a real win. The honest read pairs the external benchmark with your internal trajectory before you judge performance.
What Moves Facebook Ad Cost Most
Audience size and competition drive cost more than creative does. A tight, contested audience costs more per result than a broad, calm one, so the first lever is who you target and when, before you blame the ad itself. Seasonality and auction pressure explain most swings that look like creative failure.
Relevance and landing experience also move cost, because Meta rewards ads that users engage and post-click experiences that convert. A strong post and a fast page lower your effective cost even in a pricey auction, so the creative and the destination are part of the cost story, not separate from it.
Reporting Costs to Leadership
Frame the cost conversation around efficiency, not the raw number. Showing that your CPA sits below the benchmark for your segment is a stronger story than showing total spend, because it proves the dollars work rather than merely being spent. Pair CPA with the outcome it bought.
Use a recurring review rather than a one-time slide. A benchmark comparison tracked over quarters shows improvement and builds the case for scaling when the numbers support it. That cadence is how cost earns a permanent seat in planning instead of a single annual mention that ages badly.