
Understanding average returns on Facebook advertising helps you set realistic expectations and identify whether your campaigns are underperforming or outpacing the competition. Industry benchmarks provide context, but your specific results depend on margins, targeting, creative quality, and funnel strategy.
This guide covers current Facebook ads ROI and ROAS benchmarks by industry, factors that influence returns, and practical ways to improve your performance.
Industry Benchmarks
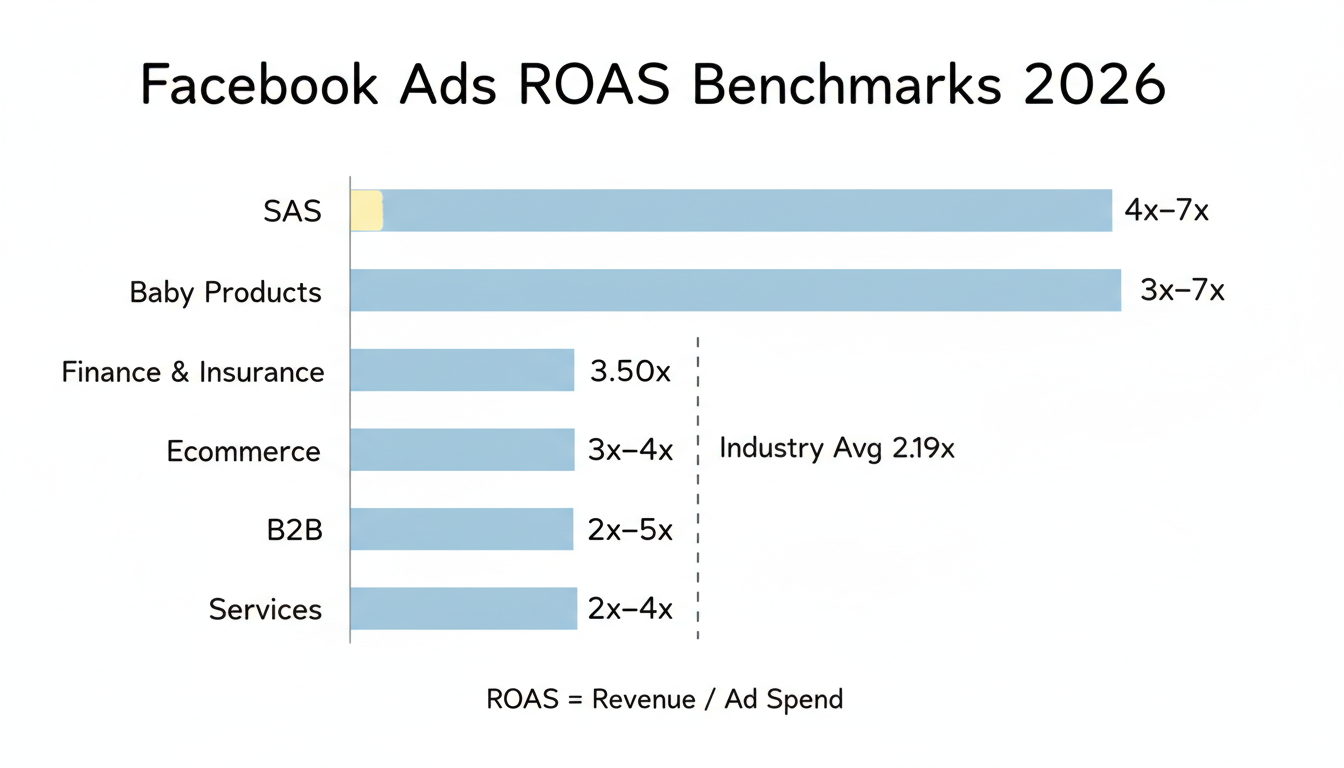
Facebook ad performance varies dramatically across industries. According to ROAS benchmark research, the 2026 average Facebook ads ROAS across all industries is 2.19:1, meaning every dollar spent returns $2.19 in tracked revenue.
However, this average masks significant variation by category.
ROAS by Industry
Industry | Average ROAS | Notes |
Baby Products | 3.71:1 | High urgency, emotional buying, repeat purchases |
Finance & Insurance | 3.50:1 | High customer lifetime value |
SaaS | 4x-7x | Long sales funnels, strong retargeting potential |
Ecommerce | 3x-4x | Variable by product category |
B2B | 2x-5x | Longer sales cycles, higher deal values |
Services | 2x-4x | Often local or niche audiences |
According to Facebook ads ROI analysis, SaaS companies often achieve the highest ROAS due to high lifetime values and strong retargeting potential.
Campaign Type Performance
According to social media advertising research, campaign type significantly impacts returns:
Campaign Type | Median ROAS |
Facebook Retargeting | 3.61x |
Facebook Overall | 2.19x |
Google Search | 4.52x |
TikTok (Value Optimization) | 2.25x |
TikTok Overall | 1.41x |
Retargeting campaigns consistently outperform prospecting campaigns because they reach people already familiar with your brand.
By Business Type
Different business models see different returns based on their economics and customer journey.
Ecommerce
Ecommerce businesses typically target 3x-4x ROAS on Facebook. According to PPC benchmark data, a 3.5:1 ROAS is a solid cross-industry benchmark.
What affects ecommerce ROAS:
- Product margins (higher margins allow lower ROAS targets)
- Average order value
- Customer lifetime value and repeat purchase rate
- Seasonality (Q4 typically sees both higher costs and higher returns)
When comparing advertising channels, businesses often evaluate Google Ads vs Facebook Ads for ecommerce to determine the optimal platform mix for their specific products and margins.
B2B and SaaS
B2B companies often see wider ROAS ranges (2x-5x) due to longer sales cycles and higher deal values. According to industry ROAS analysis, B2B SaaS typically achieves 1.70x ROAS on paid search while Facebook can deliver 1.8x average.
B2B considerations:
- Longer sales cycles mean delayed attribution
- Focus on cost per lead rather than direct ROAS
- Higher deal values can justify lower conversion rates
Local Services
Service businesses often see 2x-4x ROAS but may focus more on cost per lead metrics. According to Facebook cost data, education services see an average CPA of $7.85 while automotive services average $43.84.
ROI Factors
Several factors determine whether your Facebook ads deliver above or below average returns.
Targeting Quality
According to social media cost research, the more specific and in-demand your audience, the more you pay to reach them. Retargeting warm audiences is almost always cheaper and delivers higher ROAS than cold prospecting.
Targeting impact on costs:
Factor | Effect |
Cold audiences | Higher CPC, lower conversion rate |
Warm retargeting | Lower CPC, higher conversion rate |
Narrow targeting | Higher CPM but potentially better quality |
Broad targeting | Lower CPM but requires strong creative |
Creative Quality
Strong creative can overcome targeting challenges and reduce costs. Facebook rewards engaging content with lower delivery costs through its relevance scoring system. If you're just getting started, learning how to create Facebook ads for beginners can help you develop effective creative assets that drive engagement.
Landing Page Experience
Your landing page directly impacts conversion rates. Slow loading, poor mobile experience, or mismatched messaging between ad and landing page kills conversions regardless of how good your targeting is.
Industry Competition
According to Facebook advertising cost analysis, costs vary dramatically by industry:
Industry | Average CPC | Average CPM |
Finance & Insurance | $3.77 | $11.37 |
B2B | $2.52 | $22.50 |
Legal Services | $1.81 | $11.31 |
Ecommerce | $0.45 | $5.33 |
Apparel | $0.45 | $5.99 |
Higher competition industries pay more per click but often have higher customer values to compensate. Understanding meta advertising cost benchmarks helps you evaluate your performance relative to competitors.
Improvement Tips
If your ROAS falls below industry benchmarks, these strategies can help improve returns.
Implement Full-Funnel Strategy
According to digital marketing budget research, social media marketing delivers an average ROI of $5.28 for every $1 spent when properly executed. The key is full-funnel implementation.
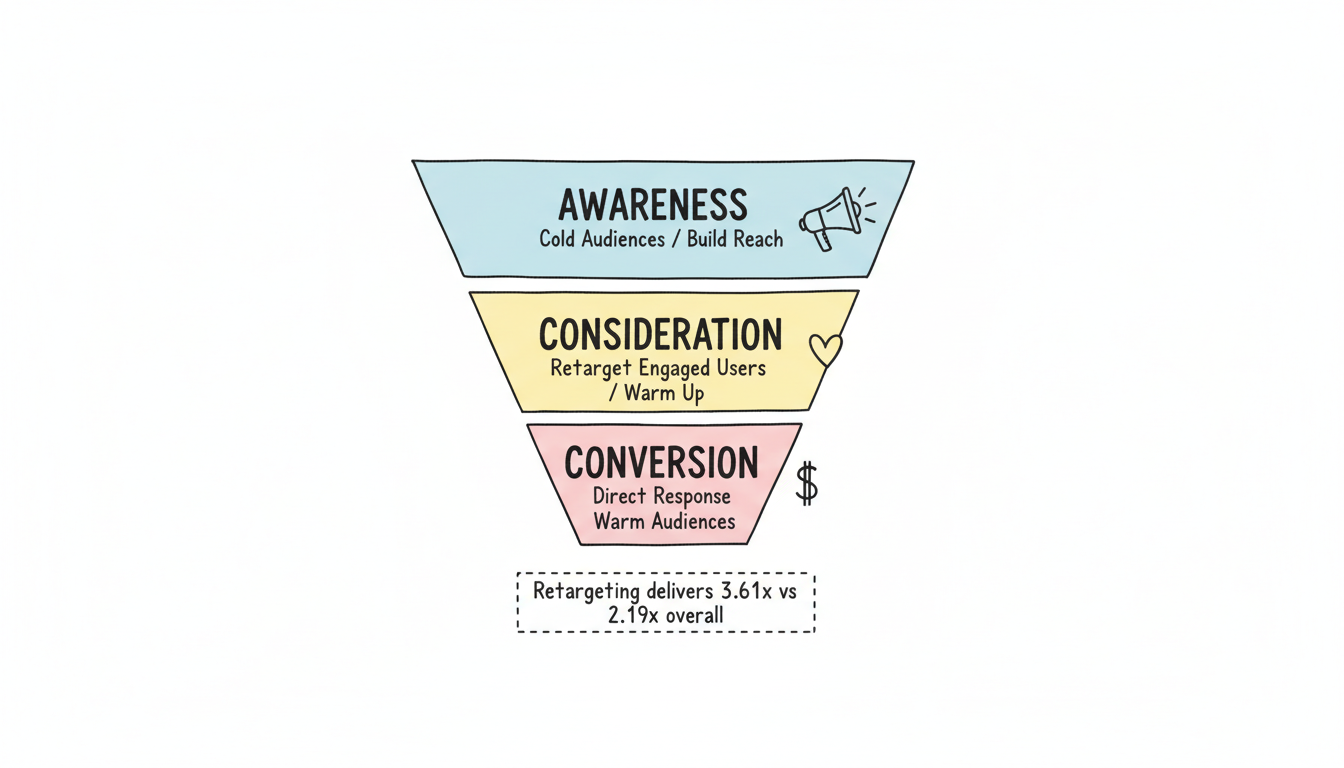
Full-funnel approach:
- Run awareness campaigns to build audience
- Retarget engaged users with consideration content
- Convert warm audiences with direct response ads
Many businesses partner with a Facebook ads management agency to develop and execute full-funnel strategies effectively, or work with specialized agencies like those offering white label Facebook ads agency services to scale their client management capabilities.
Focus on Retargeting
Since retargeting campaigns deliver 3.61x median ROAS compared to 2.19x overall, increasing your retargeting budget allocation often improves overall account performance.
Retargeting audiences to build:
- Website visitors (past 30-180 days)
- Add-to-cart abandoners
- Video viewers (50%+ completion)
- Page and post engagers
Test Creative Continuously
Creative fatigue kills performance over time. Test new formats, messages, and visuals regularly to maintain engagement and keep costs down.
Improve Tracking
Poor tracking understates your true ROAS. Implement both Meta Pixel and Conversions API to capture more conversion data, especially with iOS privacy changes limiting browser-based tracking. Using a Facebook ads ROI calculator can help you measure true performance across different attribution windows.
How to Calculate ROI Honestly
ROI is revenue minus spend divided by spend, but the hard part is attribution. Use a model that credits assisted and view-through conversions, not just last click, because Facebook often starts the journey that closes elsewhere. The honest ROI counts the influence, not only the final tap.
Separate new-customer ROI from repeat-purchase ROI, because the two answer different questions. A campaign that looks weak on first order may be strong once lifetime value lands, so report both and let the blended figure reflect the real return rather than the shallow one.
Benchmarks Versus Your Reality
Industry ROI averages are context, not a target. If your business model differs from the median, the benchmark may be irrelevant, so anchor on your own historical range and a small live test before judging a campaign. Use benchmarks to question assumptions, not to justify a number you already wanted.
Watch for lag. ROI reported the day after spend rarely captures delayed conversions, so wait a full attribution window before calling a result. A campaign judged too early looks like a loss; the same campaign at full window may be fine, and the patience is what keeps the read accurate.
Improving ROI Without Raising Spend
Most ROI gains come from targeting and landing experience, not from bigger budgets. Tighten the audience to buyers who convert, speed the page, and align the creative to the offer, because each of those lifts return per dollar without adding cost. The lever is efficiency, not volume.
Prune what does not work on a fixed cadence. An ad set that drains spend without conversion should pause, not linger in hope, and the discipline of cutting losers is what protects the ROI of the winners. Small, regular trims beat one large overhaul after a quarter of waste.
Frequently Asked Questions
What Is a Good ROAS for Facebook Ads?
According to industry benchmarks, a 4-6x ROAS is often cited as a target, but "good" depends entirely on your margins. A business with 70% margins can be profitable at 2x ROAS, while a business with 30% margins needs 4x+ to break even. Calculate your break-even ROAS based on your specific economics. To understand profitability better, consider exploring what is good ROI Facebook ads for your specific business model.
Why Is My Facebook Ads ROI Lower Than Average?
Common causes include targeting cold audiences without warm-up campaigns, poor creative that fails to engage, landing pages that do not convert, and inadequate tracking that misses conversions. Start by auditing your funnel end-to-end rather than just adjusting ad settings.
How Do I Calculate Facebook Ads ROI?
ROI = (Revenue from ads - Cost of ads) / Cost of ads. If you spend $1,000 and generate $3,000 in revenue, your ROI is 200%. ROAS uses a simpler formula: Revenue / Ad Spend. The same example would show 3x ROAS.