
AI search platforms deliver vastly different ROI profiles. ChatGPT drives 89% of measured AI referral traffic. Perplexity users are 6.2x more likely to click citations. Google AI Overviews reach the largest audience but create the most click competition. Understanding these dynamics enables strategic resource allocation that maximizes returns across your AI search portfolio.
This guide provides a comprehensive framework for calculating AI search ROI by platform, helping you determine where to invest for optimal returns.
The AI Search Investment Landscape
Before analyzing ROI, understanding the current market landscape establishes context for investment decisions.
Market Size and Reach by Platform
ChatGPT: 800+ million weekly active users as of late 2025, making it the dominant AI discovery platform. When AI search traffic clicks through to websites, 89% comes from ChatGPT—representing the largest potential traffic source but also the most competitive environment. The Perplexity vs ChatGPT SEO comparison reveals significant differences in how these platforms drive traffic.
Google AI Overviews: Appears on a growing percentage of Google searches, reaching billions of users daily. However, AI Overviews have dramatically changed click behavior—CTR drops from 15% to approximately 8% when overviews appear, with only 1% of users clicking source links within the overview. Understanding the Google AI Overview update frequency helps predict visibility changes.
Perplexity: Smaller user base but exceptional engagement. With a Referral Efficiency Index of 6.2x, Perplexity users click citations far more frequently than users on any other AI platform, making it disproportionately valuable for traffic generation.
Microsoft Copilot: Integrated into Windows, Office, and Bing, reaching millions of enterprise users. Particularly valuable for B2B brands targeting professional audiences who use Microsoft's ecosystem. The Microsoft Copilot vs Bing AI analysis shows how these platforms complement each other.
Investment Categories
AI search optimization investments fall into three categories:
Time Investment: Content creation, optimization, and monitoring hours Budget Investment: Tools, platforms, agencies, and paid strategies Resource Investment: Team expertise, technology infrastructure, and cross-department coordination
Each platform requires different investment mixes, affecting ROI calculations significantly. Organizations implementing generative AI for SEO strategies must allocate resources across multiple channels.
Calculating AI Search ROI by Platform
ROI calculation for AI search requires platform-specific metrics that account for traffic quality, conversion rates, and attribution complexity.
The Basic ROI Formula
AI Search ROI = (Revenue from AI Referrals - Investment Cost) / Investment Cost × 100This simple formula becomes complex in practice because:
- Attribution varies by platform (some provide clear referral data, others don't)
- Traffic quality differs significantly between platforms
- Conversion paths involve multiple touchpoints
- Brand exposure value is difficult to quantify
Platform-Specific ROI Metrics
Google AI Overviews:
- Primary metric: Citation share (% of target queries where you're cited)
- Secondary metrics: Brand search lift, direct traffic increases
- Attribution challenge: Many exposures don't generate trackable clicks
Optimizing your Google AI Overviews logo can improve brand recognition even when users don't click through.
ChatGPT:
- Primary metric: Referral traffic volume
- Secondary metrics: Citation frequency, recommendation sentiment
- Attribution advantage: Clear referral tracking when users click through
Perplexity:
- Primary metric: Click-through rate from citations
- Secondary metrics: Citation prominence, response positioning
- Attribution advantage: Source links are displayed prominently
Microsoft Copilot:
- Primary metric: Enterprise user engagement
- Secondary metrics: B2B lead quality, professional audience reach
- Attribution challenge: Integrated into workflows, harder to track
Investment Required by Platform
Resource allocation differs significantly across platforms, affecting ROI calculations. Professional answer engine optimization services can help streamline multi-platform strategies.
Google AI Overviews Investment Profile
Time Investment: High
- Traditional SEO foundation required (87% of citations come from top-10 organic results)
- Content optimization for extraction
- Ongoing freshness maintenance
- Schema markup implementation
Budget Investment: Moderate to High
- $99-$500/month for tracking tools (Semrush AI Toolkit, Ahrefs Brand Radar)
- Potential agency support: $3,000-$10,000/month
- Content production: $2,000-$5,000/month
Resource Investment: High
- Requires integration with existing SEO efforts
- Cross-functional coordination (SEO, content, technical teams)
- Continuous monitoring and optimization
Total Monthly Investment Range: $5,000-$20,000 for serious optimization
ChatGPT Investment Profile
Time Investment: Moderate to High
- Content creation optimized for citation
- Entity optimization and authority building
- Monitoring and response analysis
Budget Investment: Moderate
- $100-$300/month for tracking tools (Otterly.AI, Profound)
- Content optimization: $1,500-$4,000/month
- Optional PR/link building: $2,000-$5,000/month
Resource Investment: Moderate
- Can be managed by existing content teams
- Less technical integration required than Google
Total Monthly Investment Range: $3,000-$12,000
Using specialized answer engine optimization tools can reduce manual effort across platforms.
Perplexity Investment Profile
Time Investment: Moderate
- Content structure optimization
- Citation-worthy depth development
- Freshness signals (Perplexity favors recently updated sources)
Budget Investment: Low to Moderate
- Basic tracking: $29-$100/month
- Content optimization: $1,000-$3,000/month
Resource Investment: Low to Moderate
- Less competitive environment
- Faster results achievable
Total Monthly Investment Range: $1,500-$5,000
Developing a comprehensive Perplexity AI optimization strategy delivers high returns relative to investment.
Microsoft Copilot Investment Profile
Time Investment: Moderate
- B2B content optimization
- Professional/enterprise focus
- LinkedIn and Microsoft ecosystem optimization
Budget Investment: Low to Moderate
- Often included in broader AI tracking tools
- Content optimization: $1,000-$3,000/month
Resource Investment: Low
- Niche focus reduces complexity
Total Monthly Investment Range: $1,500-$5,000
Traffic Volume vs. Traffic Quality Trade-Offs
Not all AI referral traffic delivers equal value. Understanding quality differences informs ROI-optimized allocation. Recent AI-powered search engine statistics reveal dramatic differences in user behavior across platforms.
Volume Leaders
Google AI Overviews:
- Highest potential reach (billions of daily users)
- But: 60% of searches end without clicks (77% on mobile)
- Traffic that does arrive is high-intent but increasingly rare
ChatGPT:
- 89% of AI referral traffic originates here
- High volume potential
- Variable quality depending on query type
Quality Leaders
Perplexity:
- 6.2x higher click-through rate on citations
- Research-focused users with high commercial intent
- Smaller volume but exceptional quality
Microsoft Copilot:
- Enterprise audience with purchasing authority
- B2B contexts typically high value
- Lower volume, higher average deal size
Traffic Quality Indicators by Platform
Platform | Volume | Quality Index | Best For |
Google AI Overviews | Very High | Moderate | Broad awareness, brand visibility |
ChatGPT | High | Moderate-High | General traffic, brand mentions |
Perplexity | Moderate | Very High | Research traffic, high-intent users |
Copilot | Low | Very High | Enterprise B2B, professional services |
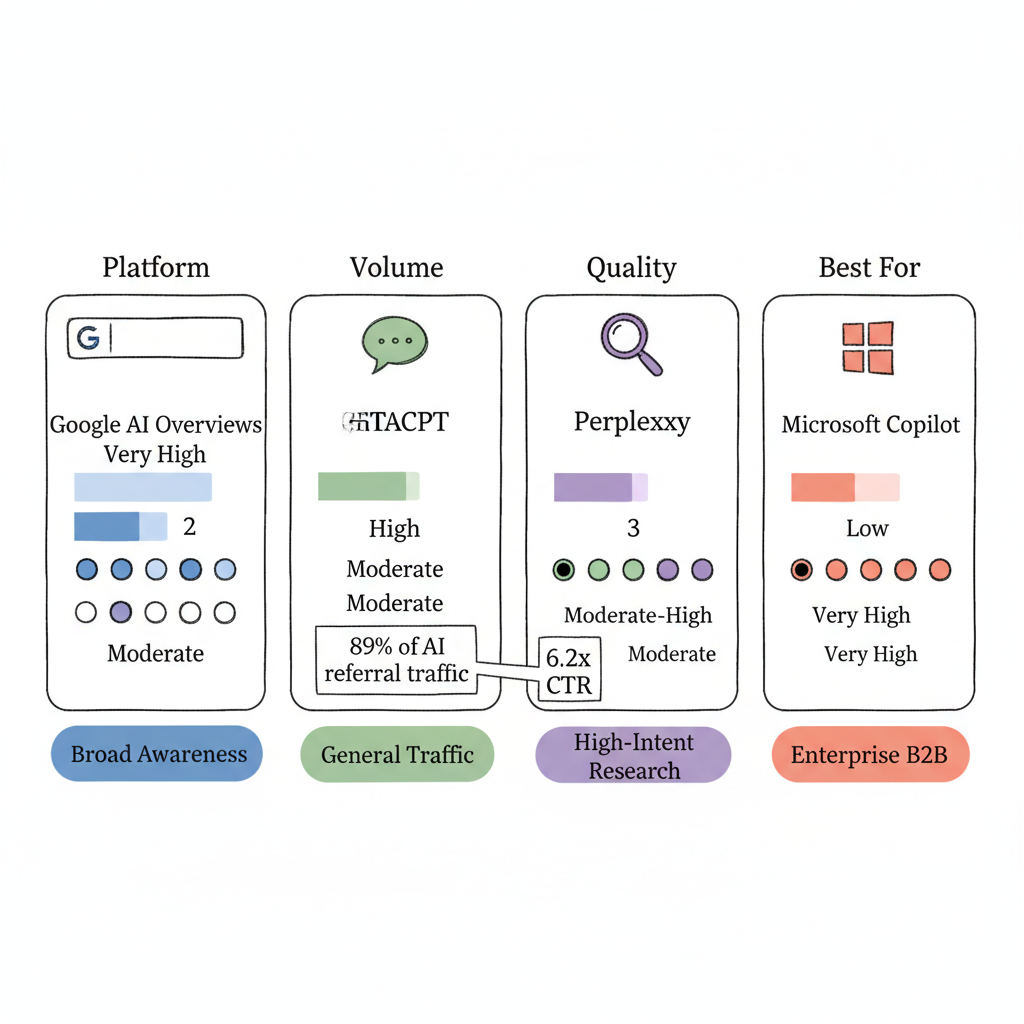
The AI search platform market share comparison 2026 provides context for these volume differences.
Conversion Rate Impact by Platform
AI search traffic converts differently than traditional organic traffic.
Conversion Rate Benchmarks
Research indicates AI-sourced traffic often converts at significantly higher rates than traditional search. Users arriving from AI recommendations have received an implicit endorsement from the AI system, creating trust that accelerates conversion.
Observed patterns:
- AI recommendation traffic: 2-5x higher conversion rates than average organic
- Perplexity referrals: Often highest converting due to research-intent alignment
- ChatGPT referrals: Strong conversion when users seek specific product recommendations
- Google AI Overview clicks: Similar to traditional organic when users do click
Factors Affecting Conversion
Recommendation context: Being cited as a "best" option converts better than neutral mentions Query intent alignment: Commercial and transactional query visibility drives higher conversion Landing page optimization: AI traffic often arrives at specific pages; optimization matters User journey stage: AI users often arrive further down the funnel
Revenue Attribution by Platform
Accurate attribution enables precise ROI calculation.
Direct Attribution Methods
UTM tracking: Add UTM parameters to trackable referrals Platform analytics: Monitor native referral reports in Google Analytics/similar First-touch attribution: Credit AI platforms for users who first discover you there Multi-touch attribution: Assign partial credit based on journey contribution
Indirect Attribution Approaches
Brand search lift: Correlate AI visibility with increases in branded search volume Direct traffic correlation: Monitor direct traffic changes alongside AI visibility improvements Survey-based attribution: Ask converting customers how they discovered you Controlled experiments: Compare periods of high/low AI visibility to measure impact
Attribution Model Selection
Business Model | Recommended Attribution |
E-commerce (short cycle) | Last-touch or time-decay |
SaaS (medium cycle) | Multi-touch with position weighting |
Enterprise B2B (long cycle) | Multi-touch with first-touch emphasis |
Brand awareness | Reach and frequency metrics |
Platform-Specific ROI Analysis
Google AI Overviews: Highest Volume, Moderate Competition
ROI Profile:
- Investment: $5,000-$20,000/month
- Expected return timeline: 3-6 months to meaningful visibility
- Break-even: 6-12 months typical
Best ROI scenarios:
- Brands with existing strong SEO performance
- Categories with high AI Overview appearance rates
- Businesses benefiting from brand exposure even without clicks
ROI calculation example:
Monthly investment: $10,000
AI Overview citations: 500 high-intent queries
Estimated exposure: 50,000 monthly impressions
Click-through: 500 clicks (1%)
Conversion rate: 4%
Conversions: 20
Average order value: $1,000
Revenue: $20,000
ROI: ($20,000 - $10,000) / $10,000 = 100%
Reviewing AI Overview case studies helps calibrate ROI expectations.
ChatGPT: Highest Traffic Volume
ROI Profile:
- Investment: $3,000-$12,000/month
- Expected return timeline: 2-4 months for initial visibility
- Break-even: 4-8 months typical
Best ROI scenarios:
- Brands in recommendation-heavy categories
- Products/services users research through conversation
- Companies able to provide comprehensive, authoritative content
Perplexity: Highest Traffic Quality (Early-Mover ROI)
ROI Profile:
- Investment: $1,500-$5,000/month
- Expected return timeline: 1-3 months
- Break-even: 2-4 months typical
Best ROI scenarios:
- Research-intensive industries
- B2B and professional services
- Brands producing original research or analysis
ROI advantage: Lower competition and higher click rates mean faster break-even despite smaller audience.
Microsoft Copilot: High-Value Enterprise (B2B)
ROI Profile:
- Investment: $1,500-$5,000/month
- Expected return timeline: 3-6 months
- Break-even: 6-12 months (offset by higher deal values)
Best ROI scenarios:
- Enterprise software and services
- B2B solutions targeting Microsoft-centric organizations
- Professional services seeking executive-level clients
Implementing targeted B2B AEO marketing strategies maximizes Copilot ROI.
Portfolio Approach to Platform Investment
Optimal AI search ROI requires portfolio thinking, not single-platform focus. Following an AI search optimization timeline roadmap helps coordinate multi-platform efforts.
Resource Allocation Framework
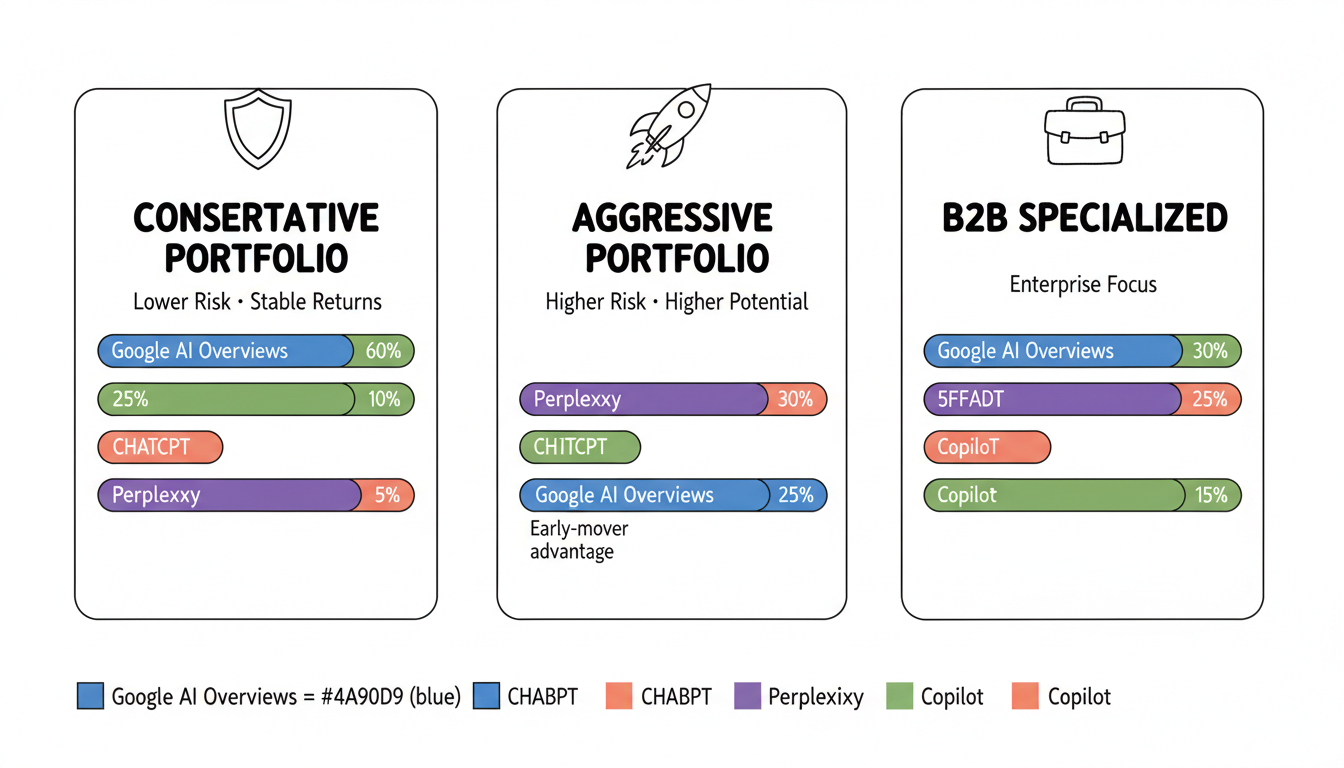
Conservative Portfolio (Lower risk, stable returns):
- Google AI Overviews: 60%
- ChatGPT: 25%
- Perplexity: 10%
- Copilot: 5%
Aggressive Portfolio (Higher risk, higher potential returns):
- Perplexity: 35% (early-mover advantage)
- ChatGPT: 30%
- Google AI Overviews: 25%
- Copilot: 10%
B2B Specialized Portfolio:
- Google AI Overviews: 30%
- Perplexity: 30%
- Microsoft Copilot: 25%
- ChatGPT: 15%
Rebalancing Triggers
Review and adjust allocation when:
- Platform market share shifts significantly
- ROI metrics deviate more than 25% from projections
- New platforms emerge with meaningful traffic
- Industry-specific platforms gain traction
Cost-Benefit Analysis Framework
Structure your analysis using this framework. Leveraging AI SEO software can reduce operational costs while improving results.
Costs (Monthly)
Category | Low Estimate | High Estimate |
AI tracking tools | $100 | $1,500 |
Content optimization | $2,000 | $8,000 |
Agency services | $0 | $15,000 |
Internal team time | $1,500 | $6,000 |
Total | $3,600 | $30,500 |
Benefits (Monthly)
Category | Measurement Method |
Direct revenue | Platform referral tracking |
Brand search lift | Branded query volume change |
Competitive displacement | Share of AI citations |
Customer acquisition cost reduction | CAC trend analysis |
Break-Even Calculation
Break-Even Point = Total Investment / (Revenue Per AI-Sourced Customer × Monthly AI Customers)Which AI Platform Delivers the Best ROI?
It depends on your business model. Perplexity typically delivers fastest ROI due to lower competition and higher click rates. Google AI Overviews offers highest potential scale for established brands. ChatGPT provides volume for consumer-focused businesses. Copilot serves B2B enterprises effectively.
How Long Before I See ROI from AI Search Optimization?
Initial visibility improvements appear within 4-8 weeks. Revenue impact typically becomes measurable at 3-6 months. Full ROI realization often takes 6-12 months as optimized content gets indexed and AI systems incorporate it into response patterns.
Should I Invest Equally Across All Platforms?
No. Allocate based on your target audience, business model, and competitive position. B2B companies should weight toward Perplexity and Copilot. Consumer brands should emphasize ChatGPT and Google AI Overviews. Adjust based on measured results.
How Do I Track AI Search ROI When Many Interactions Don'T Generate Clicks?
Supplement click-based metrics with brand health indicators: branded search volume, direct traffic trends, survey-based attribution, and correlation analysis between AI visibility and business outcomes.