
Knowing your Facebook ads ROI is essential for determining whether your campaigns are profitable - and where to invest more. Without accurate ROI tracking, you're essentially flying blind with your ad budget.
This guide covers the formulas you need, step-by-step calculation methods, industry benchmarks, and actionable strategies to improve your returns.
ROI Formula
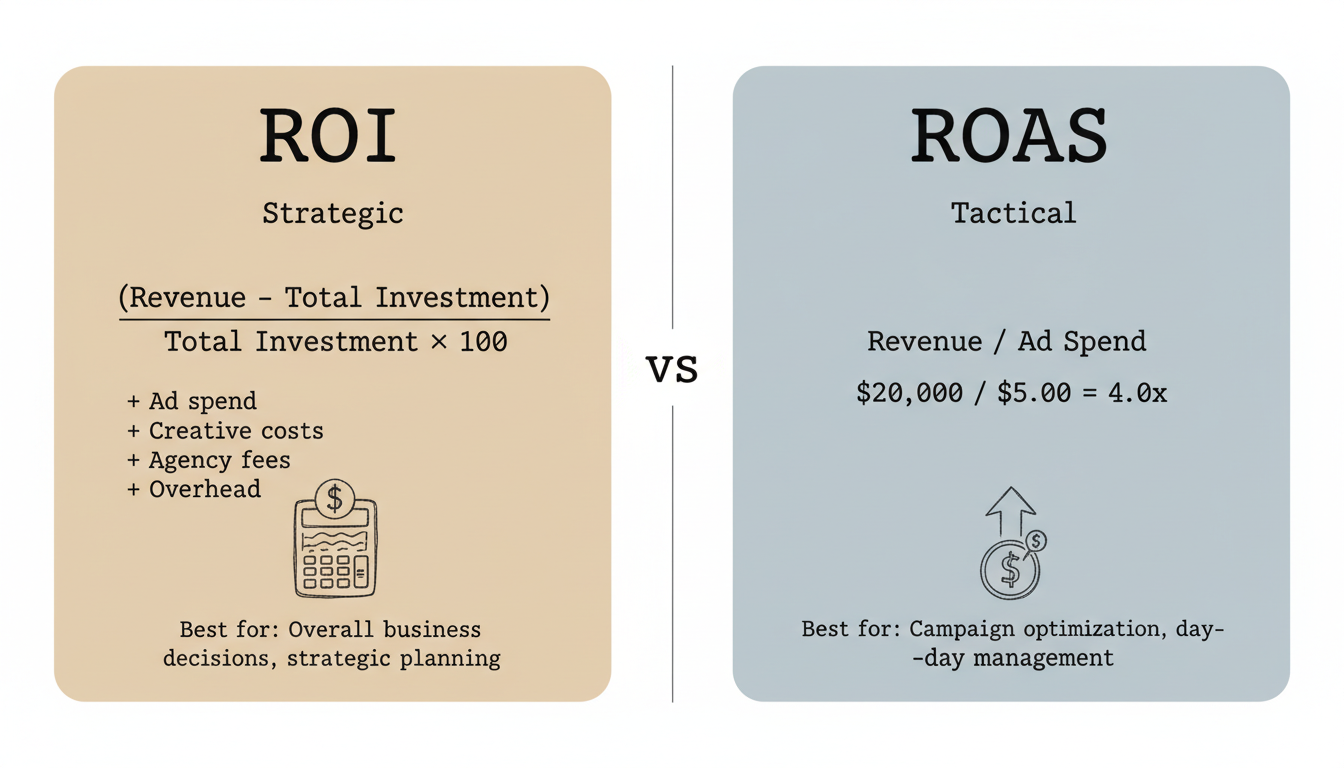
ROI (Return on Investment) and ROAS (Return on Ad Spend) are related but measure different things. Understanding both is crucial for accurate performance analysis.
The ROI Formula
ROI measures total profitability after accounting for all costs:
ROI = ((Revenue - Total Investment) / Total Investment) 100
Total investment includes:
- Facebook ad spend
- Creative production costs (design, video, copywriting)
- Agency or management fees
- Overhead allocated to advertising
According to marketing performance data, the ROI formula gives you a complete financial picture that accounts for all expenses, not just ad spend.
The ROAS Formula
ROAS focuses specifically on revenue generated compared to ad spend:
ROAS = Revenue from Ads / Cost of Ads
For example, if you spent $5,000 on a Facebook campaign and generated $20,000 in revenue, your ROAS would be:
$20,000 / $5,000 = 4.0 ROAS
This means you earn $4 for every $1 spent on ads. ROAS is often expressed as a multiplier (4x or 4:1) or as a percentage (400%).
ROI vs. ROAS: Which to Use
Metric | What It Measures | Best For |
ROI | Total profitability after all costs | Overall business decisions |
ROAS | Revenue per advertising dollar | Campaign optimization |
ROAS is the more common metric for day-to-day campaign management because it's simpler to track and directly available in Ads Manager. ROI is better for strategic decisions about your overall advertising investment.
Step-By-Step Calculation
Follow this process to calculate your Facebook ads ROI accurately:
Step 1: Add Up Your Total Investment
Include all costs associated with your campaign:
- Ad spend: Your total Facebook budget
- Creative costs: Graphics, video production, copywriting
- Management fees: Agency or in-house team time
- Tools: Any paid software for optimization
Example: $2,000 ad spend + $500 creative = $2,500 total investment
Understanding the average cost of facebook ads helps you budget realistically for your total investment.
Step 2: Measure Your Conversions
Track the results based on your campaign objective:
- E-commerce: Number and value of purchases
- Lead generation: Number of leads average customer value
- App installs: Installs that generate revenue
Example: 100 purchases at $50 average = $5,000 revenue
Step 3: Calculate Your ROI
Apply the formula:
ROI = (($5,000 - $2,500) / $2,500) 100 = 100% ROI
A 100% ROI means you doubled your investment.
Step 4: Calculate Your ROAS
For just the ad spend portion:
ROAS = $5,000 / $2,000 = 2.5x ROAS
You earned $2.50 for every $1 spent on ads.
Step 5: Track Over Time
Don't judge campaigns on a single day. Allow 14-21 days minimum for the algorithm to optimize and costs to stabilize before making major decisions.
Benchmarks
Understanding industry benchmarks helps you set realistic targets and identify underperforming campaigns.
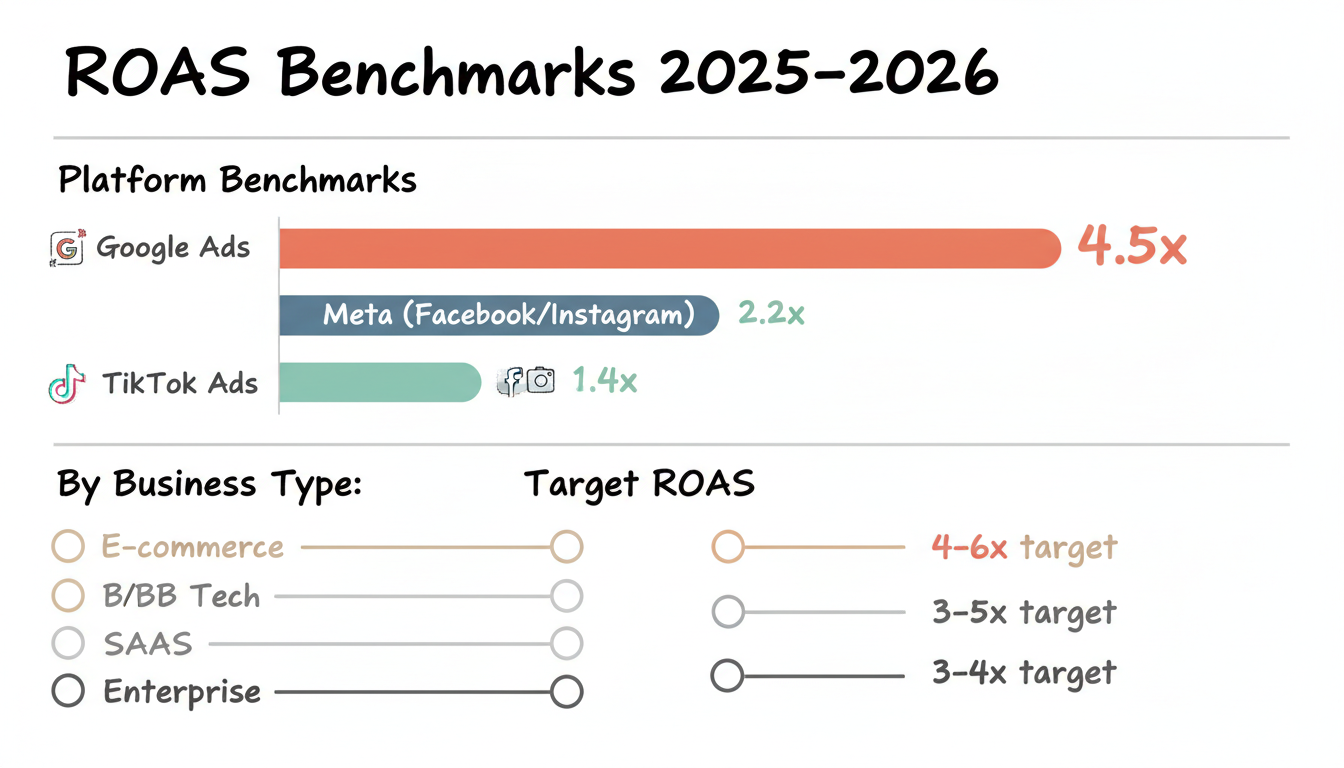
ROAS Benchmarks by Platform (2025-2026)
According to recent benchmark data:
Platform | Average ROAS |
Google Ads | 4.5x |
Meta (Facebook/Instagram) | 2.2x |
TikTok Ads | 1.4x |
ROAS Benchmarks by Business Type
Industry research shows ROAS varies significantly by sector:
Business Type | Typical ROAS Target |
E-commerce | 4-6x |
B2B Tech | 3-5x |
SaaS | 3-4x |
Enterprise | 2-3x |
If you're starting a facebook ads agency, understanding these benchmarks is critical for setting client expectations.
Facebook Ads Cost Benchmarks by Industry
For context on what's achievable, here are 2026 industry averages:
Industry | Avg. CPC | Avg. CPM | Avg. CPA |
E-commerce | $0.45 | $5.33 | $45.00 |
Retail | $0.70 | $1.38 | $21.47 |
Healthcare | $1.32 | $5.78 | $12.31 |
B2B | $2.52 | $22.50 | $23.77 |
Finance & Insurance | $3.77 | $11.37 | $41.43 |
What'S A "Good" ROI?
A ROAS of 4x or higher is generally considered effective and profitable for most businesses. However, your target should depend on:
- Profit margins: Lower margins require higher ROAS
- Customer lifetime value: High LTV justifies lower initial ROAS
- Business stage: Growth-focused companies may accept lower ROAS
Improving ROI
Once you're tracking ROI, focus on strategies to improve it.
1. Optimize Your Creative
Creative quality has the biggest impact on performance. According to scaling best practices, keeping only top-performing ads active can boost conversion volume by 15-30%.
Test these elements:
- Hook variations (first 3 seconds of video)
- Visual style (polished vs. authentic)
- Copy length and messaging angles
- Call-to-action buttons
2. Run Retargeting Campaigns
Retargeting warm audiences almost always produces better ROI than cold traffic. Use Meta Pixel to track website visitors and create audiences based on specific actions like cart abandonment or page views.
Learning how to run facebook ads for business effectively includes mastering retargeting strategies.
3. Scale Budgets Gradually
Increasing budgets by more than 20-30% often triggers a learning reset and can raise CPA by 25-40%. Scale winning campaigns slowly to maintain performance.
4. Implement Proper Tracking
Ensure your Meta Pixel and Conversions API (CAPI) are correctly configured. Incomplete tracking means incomplete data, leading to poor optimization decisions.
5. Focus on High-Value Conversions
Optimize for purchases or qualified leads rather than clicks or engagement. Facebook's algorithm works best when given clear conversion signals.
Staying compliant with meta ads policy while optimizing for conversions ensures your campaigns remain active and effective.
Building a Simple ROI Calculator in a Spreadsheet
You do not need paid software to model Facebook ad ROI. Start a sheet with columns for spend, creative cost, management cost, and revenue, then apply the formulas from this guide to compute ROI and ROAS per campaign. Add a column for customer lifetime value so you can see whether a campaign that looks weak on first-purchase ROAS is actually profitable once retention is included.
The value of a homemade calculator is the discipline it forces. When every campaign must pass through the same inputs, you stop comparing channels on vibes and start comparing them on contribution margin. Update it weekly, and use it as the single source of truth in budget reviews rather than the platform's headline numbers, which exclude the costs that quietly erode profit.
Common ROI Calculation Mistakes
The most expensive mistake is counting only ad spend as the investment, which inflates ROAS and hides unprofitable campaigns. Creative production, agency fees, and tooling are real costs that belong in the ROI denominator. A second mistake is measuring too early, before the algorithm has stabilized, which leads to killing winners and scaling losers based on noise.
A third mistake is ignoring the lag between ad click and conversion. Many purchases happen days after the touch, so same-day attribution understates true ROI. Use a window long enough to capture your real sales cycle, and reconcile platform-reported revenue with your backend orders so the calculator reflects money in the bank, not just platform events.
Using ROI Data to Guide Budget Decisions
ROI and ROAS numbers only matter if they change what you do next. The cleanest rule is to shift budget toward the campaigns that clear your profitability threshold and pause those that do not after a fair test window. Segment by audience and creative so you can see which combination earns the return, rather than judging an entire campaign as good or bad.
Tie the calculator to planning, not just reporting. Before launching a new campaign, estimate the ROAS needed to break even given your margins, and set that as the success bar from day one. When the live numbers cross it, scale gradually; when they fall short, the calculator tells you exactly how much efficiency you must recover before the spend is justified.
Key Takeaways
- ROI measures total profitability; ROAS measures revenue per ad dollar spent
- The standard ROAS formula: Revenue / Ad Spend = ROAS
- A ROAS of 4x or higher is generally considered profitable for most businesses
- Meta ads average 2.2x ROAS in 2025-2026, but results vary significantly by industry
- Improve ROI by optimizing creative, running retargeting, and scaling budgets gradually