
Generative Engine Optimization (GEO) represents a fundamental shift in how businesses achieve search visibility. But as AI-powered search engines proliferate, a critical question emerges: how do you actually measure GEO success?
Traditional SEO metrics—rankings, clicks, impressions—don't capture AI visibility. When ChatGPT cites your content or Google AI Overviews references your brand, standard analytics tools miss it entirely.
This guide provides the complete framework for GEO measurement, covering the metrics that matter, the tools available in 2026, and practical approaches to building a GEO analytics dashboard that demonstrates ROI.
Why GEO Measurement Is Challenging
Traditional search analytics work because clicks create trackable events. When a user clicks your Google result, analytics tools capture the referral source, landing page, and subsequent behavior.
AI search breaks this model in several ways:
Zero-click citations: When ChatGPT or Perplexity cites your content, users often get the information they need without visiting your site. There's no click to track.
Fragmented attribution: AI systems synthesize information from multiple sources. Your brand might be mentioned alongside five competitors in a single response, but you have no visibility into how often this happens.
Platform opacity: AI platforms don't provide publisher analytics dashboards. Unlike Google Search Console, there's no Perplexity Console or ChatGPT Analytics.
Dynamic responses: AI-generated answers vary based on user queries, conversation context, and model updates. The same query can produce different citations across sessions.
According to Meltwater's 2026 analysis of LLM metrics, most organizations lack visibility into how their brand appears in AI-generated responses—a critical blind spot as AI search adoption accelerates.
GEO Analytics Stack Setup
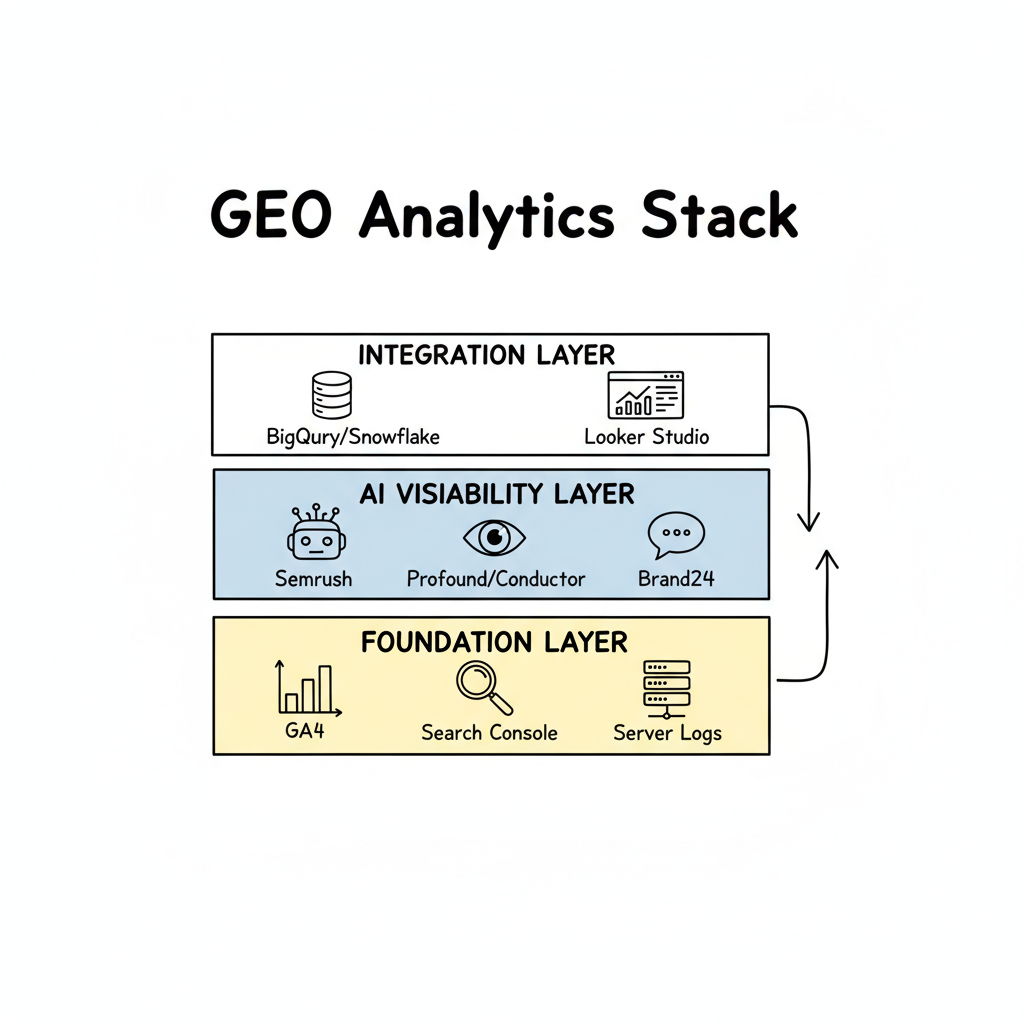
Building a GEO analytics capability requires layering specialized tools on top of your existing analytics infrastructure.
Foundation Layer: Traditional Analytics
Your GEO stack builds on existing tools:
- Google Analytics 4: Track traffic from AI referral sources
- Google Search Console: Monitor AI Overview appearances
- Server logs: Capture bot traffic and AI crawler activity
AI Visibility Layer: Specialized Tools
Add tools specifically designed for AI search tracking:
- AI citation monitoring: Semrush, Profound, Conductor
- Brand mention tracking: Scrunch AI, Brand24 with AI filters
- Share of voice analysis: Conductor, Meltwater
Integration Layer: Unified Dashboard
Connect data sources into a single view:
- Data warehouse: BigQuery, Snowflake, or similar
- Visualization: Looker Studio, Tableau, or custom dashboard
- Automation: Scheduled exports and API integrations
Key Performance Indicators for GEO
Effective GEO measurement requires tracking metrics across three categories: visibility, engagement, and business impact.
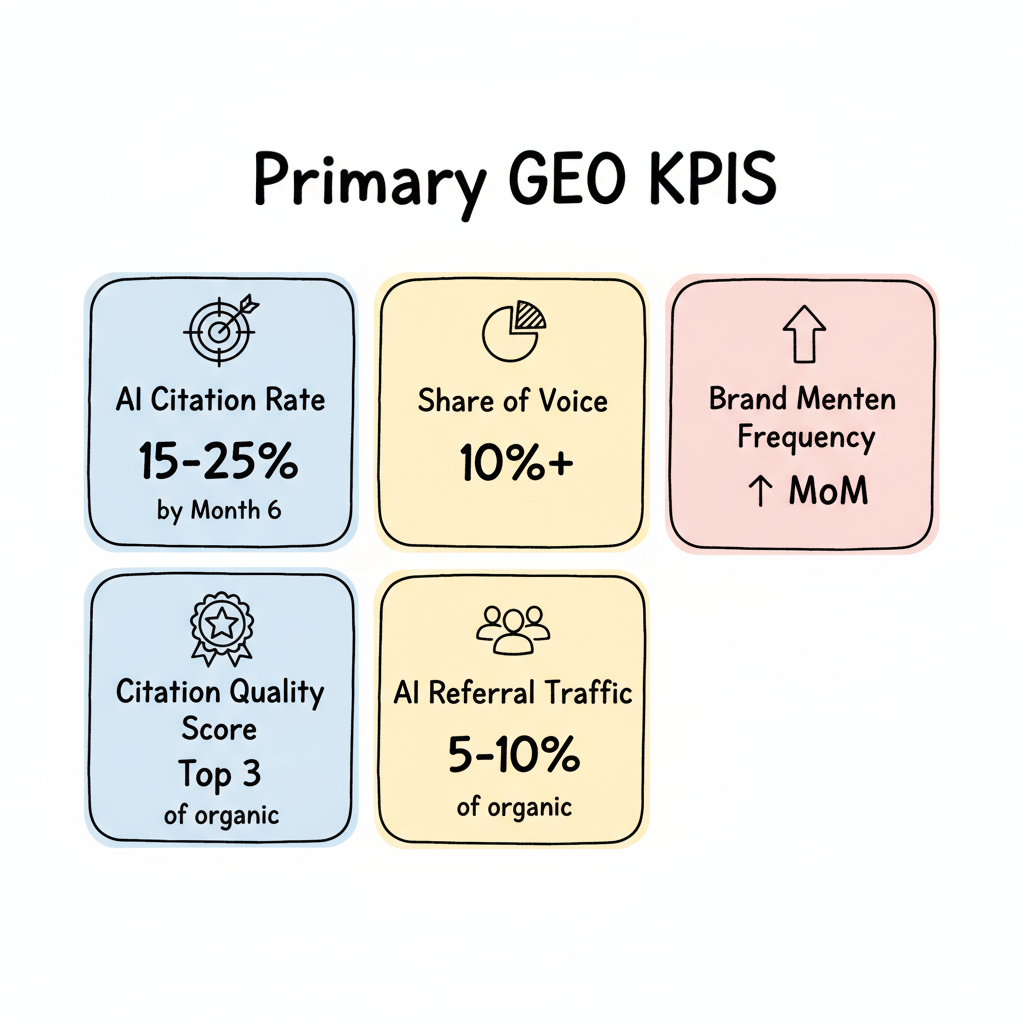
Primary GEO Kpis
Metric | Definition | Target Benchmark |
AI Citation Rate | % of target queries where you're cited | 15-25% by Month 6 |
Share of Voice (SOV) | Your citations vs. competitors | 10%+ by Month 6 |
Brand Mention Frequency | Times brand appears in AI responses | Growth month-over-month |
Citation Quality Score | Position and prominence of citations | Top 3 sources |
AI Referral Traffic | Visits from AI platform referrals | 5-10% of organic traffic |
Secondary GEO Kpis
Metric | Definition | Why It Matters |
Query Coverage | Topics where you appear in AI responses | Content gap identification |
Sentiment Analysis | Tone of AI mentions about your brand | Reputation management |
Citation Retention | How long citations persist | Content durability |
Cross-Platform Presence | Visibility across ChatGPT, Perplexity, Google | Platform diversification |
According to Conductor's 2026 AEO/GEO Benchmarks Report, organizations with mature GEO programs target 5%+ Share of Voice by Month 3 and 10%+ by Month 6—achievable goals for focused optimization efforts.
Share of Voice Tracking Across Platforms
Share of Voice (SOV) measures your AI visibility relative to competitors. It's the GEO equivalent of traditional search market share.
Calculating GEO Share of Voice
The basic SOV formula:
GEO SOV = (Your AI Citations / Total Citations in Category) × 100For practical measurement:
- Define your category: Select 50-100 queries representing your market
- Run queries across platforms: ChatGPT, Perplexity, Google AI Mode
- Track citations: Count mentions for you and competitors
- Calculate percentages: Your citations divided by total
SOV Tracking Methodology
Manual sampling approach:
- Run 20-30 target queries weekly
- Document citations for each query
- Track changes over time in spreadsheet
Automated tracking:
- Tools like Semrush's AI Visibility Toolkit automate this process
- Set up monitoring for target queries
- Receive alerts when SOV changes significantly
Interpreting SOV Data
SOV Level | Interpretation | Action |
<5% | Minimal AI visibility | Foundational GEO work needed |
5-15% | Emerging presence | Expand content coverage |
15-30% | Competitive position | Defend and grow |
30%+ | Market leader | Protect and diversify |
Citation Frequency Measurement
Citation frequency tracks how often AI systems reference your content. Unlike SOV (which is relative), citation frequency measures absolute visibility.
What Counts as a Citation?
AI citations fall into several categories:
Direct citations: AI explicitly names your brand or links to your content
- "According to [Brand], the best approach is..."
- "[Source URL] provides detailed guidance on..."
Indirect references: AI uses your content without explicit attribution
- Paraphrased information from your content
- Data or statistics originating from your research
Brand mentions: Your brand appears in AI responses
- "Popular options include [Brand], [Competitor], and [Competitor]"
- "Experts like [Brand] recommend..."
Tracking Citation Frequency
Query-based tracking:
- Identify 50+ target queries for your business
- Run queries across ChatGPT, Perplexity, Google AI
- Document every citation type
- Calculate frequency (citations per query)
Topic-based tracking:
- Define 5-10 core topics for your business
- Create query variations for each topic
- Track citations by topic area
- Identify strength and gap areas
Citation Quality Scoring
Not all citations are equal. Weight citations by:
- Position: First-mentioned vs. also-mentioned
- Context: Featured source vs. alternative option
- Platform reach: Google AI Overview vs. niche AI tool
- Query volume: High-traffic queries vs. long-tail
AI-Driven Traffic Segmentation
While direct AI referral traffic is limited (most AI interactions don't generate clicks), you can segment and analyze the traffic that does arrive.
Identifying AI Referral Traffic
In Google Analytics 4:
Navigate to Traffic Acquisition > Session Source to find AI referrals:
- perplexity.ai (direct Perplexity referrals)
- chat.openai.com (ChatGPT with browsing)
- you.com (You.com AI search)
- google.com with AI-related landing pages
In server logs:
Monitor bot traffic from AI systems:
- OpenAI's crawlers
- Perplexity's indexing bots
- Google's AI-related user agents
Creating AI Traffic Segments
Build GA4 segments to isolate AI-influenced traffic:
Segment 1: Direct AI Referrals
- Source contains: perplexity, openai, you.com
Segment 2: AI-Assisted Journeys
- Users who visited AI platforms and your site in same session (requires cross-site tracking)
Segment 3: AI-Likely Traffic
- Landing pages optimized for AI + direct traffic (users who saw your brand in AI, then navigated directly)
Measuring AI Traffic Quality
Compare AI-referred traffic against other sources:
Metric | AI Referrals | Organic Search | Benchmark |
Bounce Rate | Track | Track | AI should be lower |
Time on Site | Track | Track | AI should be higher |
Pages per Session | Track | Track | AI should be higher |
Conversion Rate | Track | Track | Varies by industry |
AI referral traffic typically shows higher engagement—users who click through from AI responses have strong intent.
Platform-Specific Tracking (ChatGPT, Perplexity, Google)
Each AI platform requires slightly different tracking approaches.
ChatGPT Tracking
What you can track:
- Brand mentions in ChatGPT responses (manual or tool-assisted)
- Referral traffic from chat.openai.com
- Bot traffic from OpenAI crawlers
Limitations:
- No publisher analytics dashboard
- Most interactions are zero-click
- Response variability makes consistent tracking difficult
Best approach:
- Use tools like Profound or Semrush for automated monitoring
- Manual sampling of target queries weekly
- Track OpenAI bot activity in server logs
Perplexity Tracking
What you can track:
- Citation frequency (Perplexity shows sources clearly)
- Direct referral traffic (perplexity.ai)
- Position in Perplexity responses
Advantages:
- Transparent citation system makes tracking easier
- Sources are prominently displayed
- Users can click through to sources
Best approach:
- Run target queries in Perplexity regularly
- Document citation positions (1st, 2nd, 3rd, etc.)
- Track referral traffic trends in GA4
Google AI Overviews Tracking
What you can track:
- Queries triggering AI Overviews (via Search Console)
- Impressions when your content appears in AIO
- Clicks from AIO cards
- Position in AIO citations
Google Search Console data: According to industry analysis, Google provides some visibility into AI Overview performance through Search Console, though the data is limited compared to traditional search metrics.
Best approach:
- Monitor Search Console for AIO-related query changes
- Use third-party tools for AIO tracking
- Track CTR changes for queries with AI Overviews
Tools for GEO Measurement
The GEO measurement tool landscape has matured significantly in 2026. Here are the leading options:
Enterprise Tools
Semrush AI Visibility Toolkit
- AI Overview tracking across keywords
- Brand visibility monitoring
- Competitor citation analysis
- Starting at $249/month (Enterprise tier)
Conductor
- Comprehensive AIO tracking
- Share of voice measurement
- Content gap identification
- Enterprise pricing (custom)
Meltwater
- LLM brand monitoring
- Cross-platform AI tracking
- Sentiment analysis
- Enterprise pricing (custom)
Mid-Market Tools
Profound
- AI citation tracking
- Brand mention monitoring
- Multi-platform coverage
- Starting at $99/month
Scrunch AI
- AI brand visibility
- Competitive analysis
- Automated reporting
- Starting at $79/month
Free/Low-Cost Options
AI Product Rankings
- Basic AI visibility checking
- No account required
- Limited features, but free
Manual tracking spreadsheet
- Run queries manually
- Document citations
- Calculate SOV yourself
- Time-intensive but free
Tool Comparison Matrix
Tool | AI Overview | ChatGPT | Perplexity | Price |
Semrush | Excellent | Good | Good | $249+/mo |
Conductor | Excellent | Good | Good | Custom |
Profound | Good | Excellent | Excellent | $99/mo |
Scrunch AI | Good | Good | Good | $79/mo |
Manual | Basic | Basic | Basic | Free |
GEO Dashboard Template (Free Download)
A GEO dashboard should provide at-a-glance visibility into AI search performance. Here's what to include:
Dashboard Structure
Section 1: Executive Summary
- Overall GEO Score (composite metric)
- Month-over-month SOV change
- Top citation wins this period
Section 2: Share of Voice
- Your SOV vs. top 5 competitors
- SOV trend over time (line chart)
- SOV by platform breakdown
Section 3: Citation Tracking
- Total citations this period
- Citations by topic/category
- Citation quality distribution
Section 4: Traffic Impact
- AI referral traffic trend
- Conversion from AI traffic
- Top AI-referred landing pages
Section 5: Competitive Intelligence
- Competitor SOV changes
- New competitor citations
- Citation gap opportunities
Recommended Data Sources
Dashboard Section | Data Source |
SOV Tracking | Semrush, Profound, or manual |
Citation Counts | GEO monitoring tool |
Traffic Data | Google Analytics 4 |
Competitive Data | GEO tool + manual research |
Update Frequency
Metric | Recommended Frequency |
SOV | Weekly |
Citations | Weekly |
Traffic | Daily (automated) |
Competitive | Monthly |
Executive Summary | Monthly |
ROI Calculation Framework
Demonstrating GEO ROI requires connecting visibility metrics to business outcomes.
GEO ROI Formula
GEO ROI = ((AI Attribution Revenue - GEO Investment) / GEO Investment) × 100Direct attribution:
AI Referral Traffic × Conversion Rate × Average Order ValueAssisted attribution:
(Total Conversions × AI Assist Rate) × AOV × Attribution Weight (typically 20-40%)Brand lift attribution:
AI Citation Count × Estimated Impression Value × Brand Lift FactorFor a B2B SaaS company:
- GEO investment: $15,000/month (tools + agency)
- AI referral conversions: 25/month × $5,000 ACV = $125,000
- Assisted conversions: 50 × 30% attribution × $5,000 = $75,000
- Total AI revenue attribution: $200,000/month
GEO ROI = (($200,000 - $15,000) / $15,000) × 100 = 1,233%Industry | Typical GEO ROI | Timeline to Positive ROI |
B2B SaaS | 300-500% | 4-6 months |
Professional Services | 250-400% | 5-7 months |
E-commerce | 150-250% | 6-9 months |
Healthcare | 200-350% | 5-8 months |
Benchmark Kpis by Industry
Industry context matters for GEO benchmarks. AI Overview rates and citation opportunities vary significantly by sector.
Industry-Specific AI Overview Rates
According to Conductor's 2026 benchmarks, AI Overview prevalence varies dramatically:
Industry | AI Overview Rate | GEO Priority |
Health Care | 48.75% | Critical |
B2B Technology | 65-70% | Critical |
Insurance | 63% | High |
Financial Services | 32.1% | High |
Jobs & Education | 33.0% | Medium |
E-commerce | 4% | Lower |
Target Kpis by Industry
B2B Technology:
- SOV target: 15-20% by Month 6
- Citation frequency: 40+ monthly
- AI referral traffic: 8-12% of organic
Professional Services:
- SOV target: 10-15% by Month 6
- Citation frequency: 30+ monthly
- AI referral traffic: 5-8% of organic
E-commerce:
- SOV target: 5-10% by Month 6
- Citation frequency: 20+ monthly
- AI referral traffic: 2-4% of organic
Maturity Model
Stage | Timeline | SOV | Citations | Capability |
Foundation | Months 1-3 | <5% | Sporadic | Basic tracking |
Growth | Months 4-6 | 5-15% | Consistent | Full dashboard |
Optimization | Months 7-12 | 15-25% | Frequent | ROI attribution |
Leadership | Year 2+ | 25%+ | Dominant | Competitive moat |
FAQs
How Often Should I Check GEO Metrics?
Weekly tracking for SOV and citations provides sufficient data without excessive effort. Traffic metrics can be monitored continuously through automated dashboards. Monthly reporting works well for executive stakeholders.
Which GEO Tool Is Best for Small Businesses?
For budget-conscious organizations, start with Profound ($99/month) or Scrunch AI ($79/month). These provide essential AI visibility tracking without enterprise pricing. Supplement with manual query tracking for key terms.
Can I Track GEO Without Paid Tools?
Yes, but it's time-intensive. Create a spreadsheet with your target queries, run them weekly across ChatGPT, Perplexity, and Google AI, and manually document citations. This works for 20-30 queries but becomes impractical at scale.
How Do I Prove GEO ROI to Leadership?
Focus on the metrics leadership cares about: revenue attribution and competitive position. Calculate AI attribution revenue using the framework above, and show SOV trends versus competitors. Case studies with specific results are particularly persuasive.
What'S a Good GEO Score?
There's no universal "GEO score" standard yet. Instead, benchmark against yourself (month-over-month improvement) and competitors (relative SOV). Aim for consistent growth in citations, SOV, and AI referral traffic.
Get our free GEO Analytics Dashboard template and setup guide. Our team has developed a comprehensive dashboard template that connects to your existing analytics infrastructure. Download now and start measuring your AI search visibility today.
Related Articles:
- What Is Generative Engine Optimization (GEO)?
- GEO vs SEO: Understanding the Difference
- AI SEO Metrics: Measuring Success in 2026
- Best AI SEO Tools & Software
- How to Get Cited in AI Search Results