Google AI Overviews don't behave identically across devices. The mobile experience differs from desktop in display format, user interaction patterns, and even trigger rates. Understanding these differences helps you test AI Overview visibility accurately and optimize content for where your audience actually searches.
Display and Layout Differences
The visual presentation of AI Overviews varies significantly by device.
Screen Real Estate
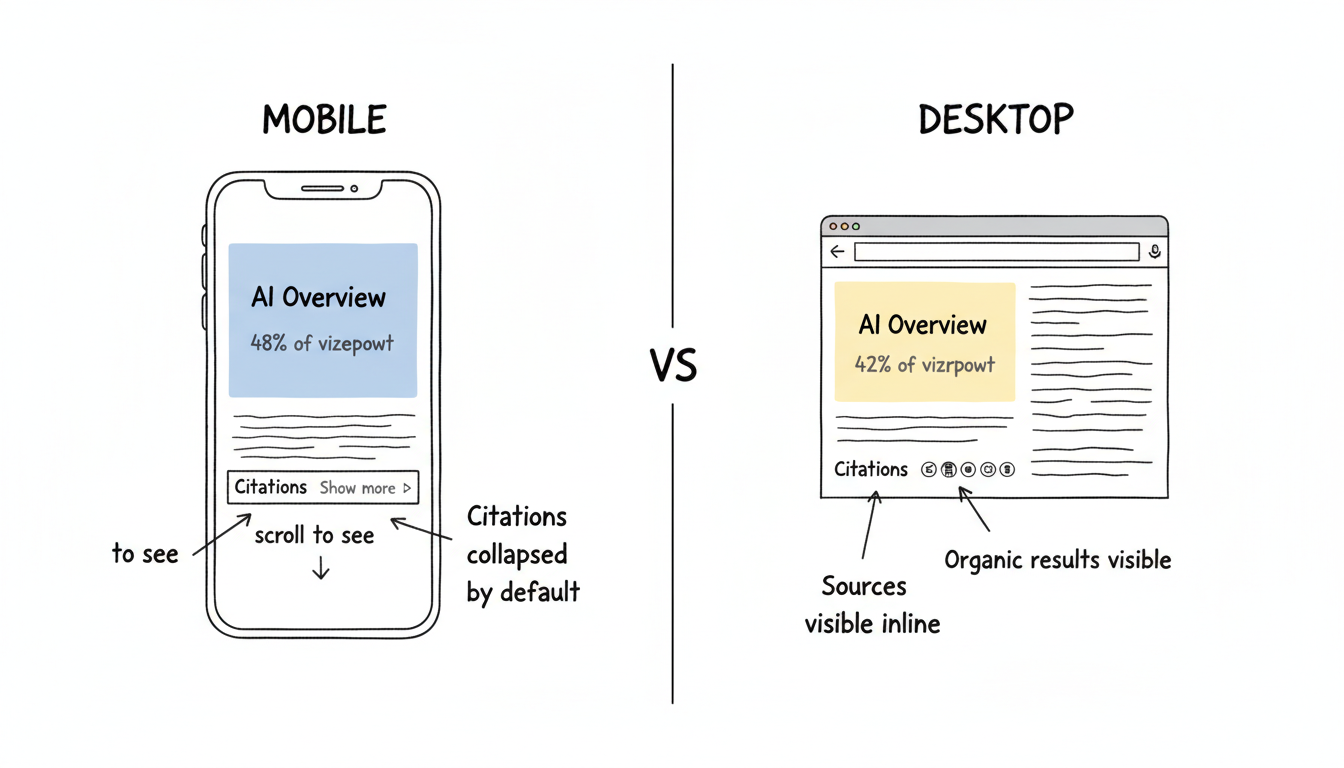
AI Overviews dominate different portions of each screen:
Device | Screen Space Used | Organic Results Position |
Desktop | 42% of viewport | Visible alongside (partially) |
Mobile | 48% of viewport | Pushed below fold |
On desktop, users can often see the AI Overview and some organic results simultaneously. On mobile, the AI Overview typically occupies the entire visible screen, requiring scrolling to reach traditional results.
Source Citation Display
How Google shows cited sources differs by device:
Desktop behavior:
- Sources often visible without expansion
- Multiple citations shown inline
- Favicon and domain clearly visible
- Related questions displayed nearby
Mobile behavior:
- Sources frequently collapsed by default
- "Show more" expansion required
- Compact citation format
- Related questions in separate section
This difference affects whether users see your site cited - and whether they click through. Understanding these AI search citation tracking patterns helps you monitor performance across both surfaces.
Expansion and Interaction
How users expand AI Overview content:
Interaction | Desktop | Mobile |
Expand sources | Click | Tap |
View full answer | Often visible | Usually collapsed |
Related questions | Visible nearby | Scroll or tap required |
Follow-up prompts | Below overview | May require scrolling |
Mobile users see condensed versions by default and must actively choose to expand for detail.
User Behavior Patterns
Mobile and desktop users interact with AI Overviews differently.
Query Types by Device
Device affects which queries users submit:
Query Characteristic | Desktop Tendency | Mobile Tendency |
Query length | Longer, more detailed | Shorter, conversational |
Voice vs. typed | Mostly typed | Significant voice input |
Research depth | Extended sessions | Quick answers |
Follow-up likelihood | Higher | Lower |
Mobile queries tend toward immediate information needs; desktop queries lean toward research and exploration.
Click-Through Behavior
Users click differently across devices:
Desktop CTR patterns:
- More likely to explore multiple sources
- Higher click-through on cited sources
- Extended time evaluating options
- Multiple tabs opened for comparison
Mobile CTR patterns:
- Often satisfied with AI answer alone
- Lower overall click-through rate
- Quick decisions on whether to click
- Single-page sessions more common
The same AI Overview citation may generate different traffic volumes depending on where users see it. This directly impacts your AEO conversion rate as mobile users demonstrate different engagement patterns.
Zero-Click Rates
Zero-click behavior varies by device:
- Mobile: Higher zero-click rate (AI answer suffices more often)
- Desktop: Users more likely to click through for detail
Approximately 81% of AI Overview queries occur on mobile, amplifying the mobile zero-click pattern's overall impact.
Trigger Rate Differences
AI Overviews don't appear at equal rates across devices.
When AI Overviews Appear
Observed trigger patterns:
Scenario | Desktop | Mobile |
Informational queries | High trigger rate | High trigger rate |
Commercial queries | Moderate | Slightly lower |
Local queries | Sometimes | Often replaced by Maps |
Transactional queries | Low | Very low |
Local queries particularly diverge - mobile often shows Google Maps integration instead of AI Overviews for location-aware searches.
Testing Implications
When checking your AI Overview visibility:
- Test both devices - Results differ between mobile and desktop for the same query
- Use device-appropriate queries - Your mobile audience may search differently
- Note expansion differences - Mobile may hide your citation behind "Show more"
A site appearing prominently in desktop AI Overviews may be less visible on mobile, and vice versa.
Strategic Implications
Device differences affect optimization approach.
Content Optimization by Device
If Your Audience Is | Optimization Priority |
Primarily mobile | Front-load key information (first extraction wins) |
Primarily desktop | Comprehensive depth supports full citations |
Mixed | Structure for mobile, depth for desktop |
Mobile-first content structure benefits both devices - concise answers that expand into depth. A comprehensive AEO implementation roadmap should account for these device-specific optimization requirements from the start.
Monitoring Strategy
Track AI Overview visibility on both surfaces:
Desktop monitoring:
- Standard incognito browser testing
- Full citation visibility checking
- Competitor comparison easier
Mobile monitoring:
- Google app testing
- Chrome mobile testing
- Tap-to-expand verification
- Voice query testing
Don't assume desktop visibility equals mobile visibility - check both. Professional AEO audit services typically include device-specific testing protocols to ensure comprehensive coverage.
Traffic Attribution Considerations
Device-level analytics help understand AI Overview impact:
Metric to Segment | Why It Matters |
Device-specific organic traffic | Compare mobile vs desktop trends |
Bounce rate by device | Mobile AI visitors behave differently |
Conversion rate by device | Mobile paths often differ |
Landing page by device | AI may cite different pages |
Changes in mobile organic traffic may indicate AI Overview changes before desktop patterns shift.
Testing AI Overviews Across Devices
Practical testing protocol:
Desktop Testing
- Open incognito/private browser window
- Search target queries on google.com
- Note: AI Overview presence, your citation status, position
- Record which sources Google cites
Mobile Testing
- Open Google app or Chrome incognito
- Search identical queries
- Tap to expand AI Overview if collapsed
- Check "Show more" for additional sources
- Note differences from desktop results
Document Discrepancies
Create a tracking comparison:
Query | Desktop AI Overview | Mobile AI Overview | Your Site Desktop | Your Site Mobile |
[query] | Present/Absent | Present/Absent | Cited/Not | Cited/Not |
Consistent tracking reveals device-specific patterns.
Why Mobile Dominates AI Overview Traffic
Roughly 81% of AI Overview queries happen on mobile, which makes the mobile experience the primary surface for most brands even when the desktop render looks healthier. The cause is behavioral: people ask the assistant a quick question on the phone and accept the synthesized answer without scrolling, whereas desktop sessions more often extend into research and comparison. Optimizing as if desktop were the default misses the majority of real-world exposure.
The implication is to lead with the mobile pattern - front-load the answer so the first extraction is the one that wins - and treat desktop depth as the supporting layer. When you test visibility, weight the mobile result as the one your audience most often sees, and do not celebrate a strong desktop citation that is collapsed behind "Show more" on the phone.
Optimizing Content for Mobile AI Overviews
Mobile rewards concision and position. Put the direct answer in the first sentence under each heading so the collapsed view still carries the substance, and keep paragraphs short enough to read without expansion. Structured elements - a tight FAQ, a comparison table, a numbered list - survive the condensed mobile layout better than long prose, and they give the model clean extraction points.
Because mobile citations are often hidden until tapped, also earn the click with a compelling title and a clear promise in the opening line, since the favicon and domain are the only brand signal visible by default. The goal on mobile is to be both the cited source and the one worth expanding, which is a slightly different bar than ranking for the click on desktop.
Local and Voice Queries: The Mobile Edge Cases
Mobile diverges most on local and voice inputs. Location-aware searches frequently return Google Maps instead of an AI Overview, so a local business should optimize its Maps presence and local schema as much as its overview content. Voice queries, common on mobile, are shorter and more conversational, which means phrasing your headings as natural questions helps capture them.
For these edge cases, test with the Google app and a voice query, not just a typed desktop search, because the result shape can differ entirely. A monitoring routine that includes voice and local checks on mobile catches the visibility you would otherwise assume does not exist, and it prevents over-investing in overview optimization where Maps or a knowledge panel is the real surface.
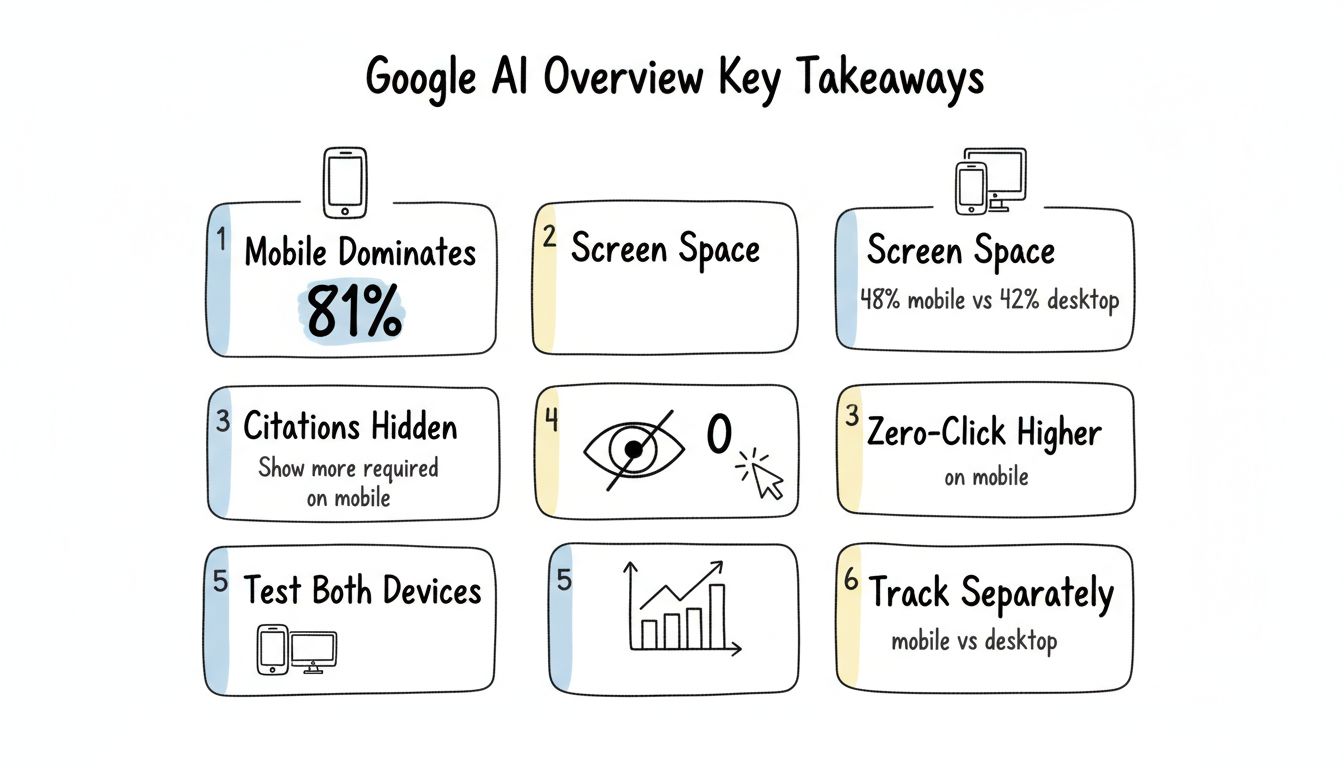
Key Takeaways
Understanding Google AI Overview mobile vs desktop differences:
- Mobile dominates - 81% of AI Overview queries are mobile; optimize accordingly
- Screen space differs - Mobile AI Overviews consume 48% of screen vs 42% desktop
- Citations hide on mobile - Sources often collapsed, requiring expansion to see
- Zero-click higher on mobile - Mobile users less likely to click through
- Test both devices - Same query may show different AI Overview behavior
- Track separately - Mobile and desktop AI traffic patterns diverge
The device your audience uses determines what AI Overview experience they encounter. Optimizing for one device without checking the other misses half the picture.