
Understanding LinkedIn click-through rate benchmarks helps you evaluate campaign performance accurately. What looks like a low CTR compared to other platforms might actually be excellent for LinkedIn's professional audience context.
This guide breaks down 2026 CTR benchmarks by ad format, industry, and audience type so you know exactly where your campaigns stand.
LinkedIn CTR Benchmarks Overview
LinkedIn's average CTR runs lower than platforms like Facebook or Google-but this reflects the platform's professional context, not poor performance. Users are more deliberate about clicks when browsing work-related content.
Platform-Wide Averages for 2026
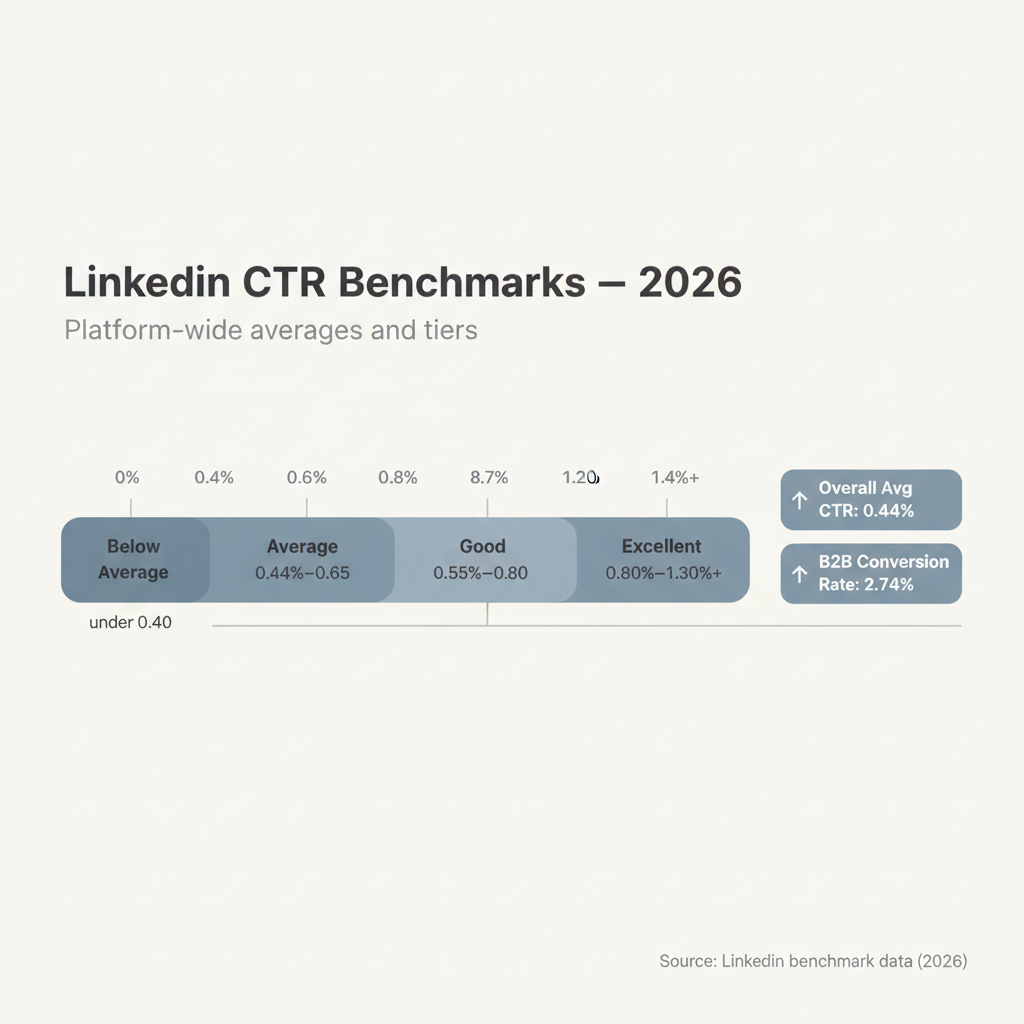
According to LinkedIn benchmark data, here's what to expect:
Performance Level | CTR Range |
Below Average | Under 0.40% |
Average | 0.44% - 0.65% |
Good | 0.55% - 0.80% |
Excellent | 0.80% - 1.30%+ |
The platform's overall average CTR sits at 0.44% with a conversion rate of 2.74% for B2B campaigns-numbers that consistently outperform other digital channels for professional audience targeting.
CTR Benchmarks by Ad Format
Ad format significantly impacts expected CTR. Some formats drive higher click rates by design, while others optimize for different engagement metrics.
Sponsored Content CTR
Standard sponsored content (single image, carousel, video) in the feed averages 0.44-0.65% CTR. According to 2026 performance data:
Format | Average CTR | Top Performer CTR |
Single Image Ads | 0.44% - 0.65% | 0.80%+ |
Document Ads | 0.50% - 0.75% | 1.0%+ |
Carousel Ads | 0.40% - 0.60% | 0.75%+ |
World-class performance on Document and Sponsored content reaches 1.3%+ CTR. For more insights on optimizing visual formats, check out our guide on LinkedIn carousel ads best practices.
Video Ads CTR
Video ads operate differently-view completion often matters more than clicks. Current benchmarks from ABM campaign analysis:
Metric | Average | Median |
CTR | 0.37% | 0.24% |
View-through Rate | 37.92% | 39.48% |
Average Watch Time | 6.54s | 5.86s |
High-performing video ads with AI subtitles achieve 0.82-1.6% CTR with 80%+ completion rates.
Thought Leader Ads (TLA) CTR
Thought Leader Ads-boosted posts from personal profiles-show dramatically different CTR patterns. According to 2026 benchmark research:
Metric | Average | Median |
Overall CTR | 3.40% | 2.68% |
CTR to Landing Page | 0.43% | 0.29% |
Dwell Time | 7.06s | 6.60s |
The high overall CTR reflects engagement with the post itself, while the landing page CTR shows actual website traffic. Top-performing TLAs drive 8.32% click rate and 1.18% CTR to landing pages.
Message Ads (Inmail) Metrics
Message Ads don't use traditional CTR-they measure open rate and click-through from the message. For a deeper dive into this format, see our complete LinkedIn sponsored messaging guide:
Metric | Benchmark |
Open Rate | 40% - 55% |
Click-Through | 3% - 7% |
These remain among the highest open rates in paid advertising.
CTR by Audience Type
Your target audience significantly impacts expected CTR. Cold audiences click less than warm ones.
Cold vs. Warm Audience CTR
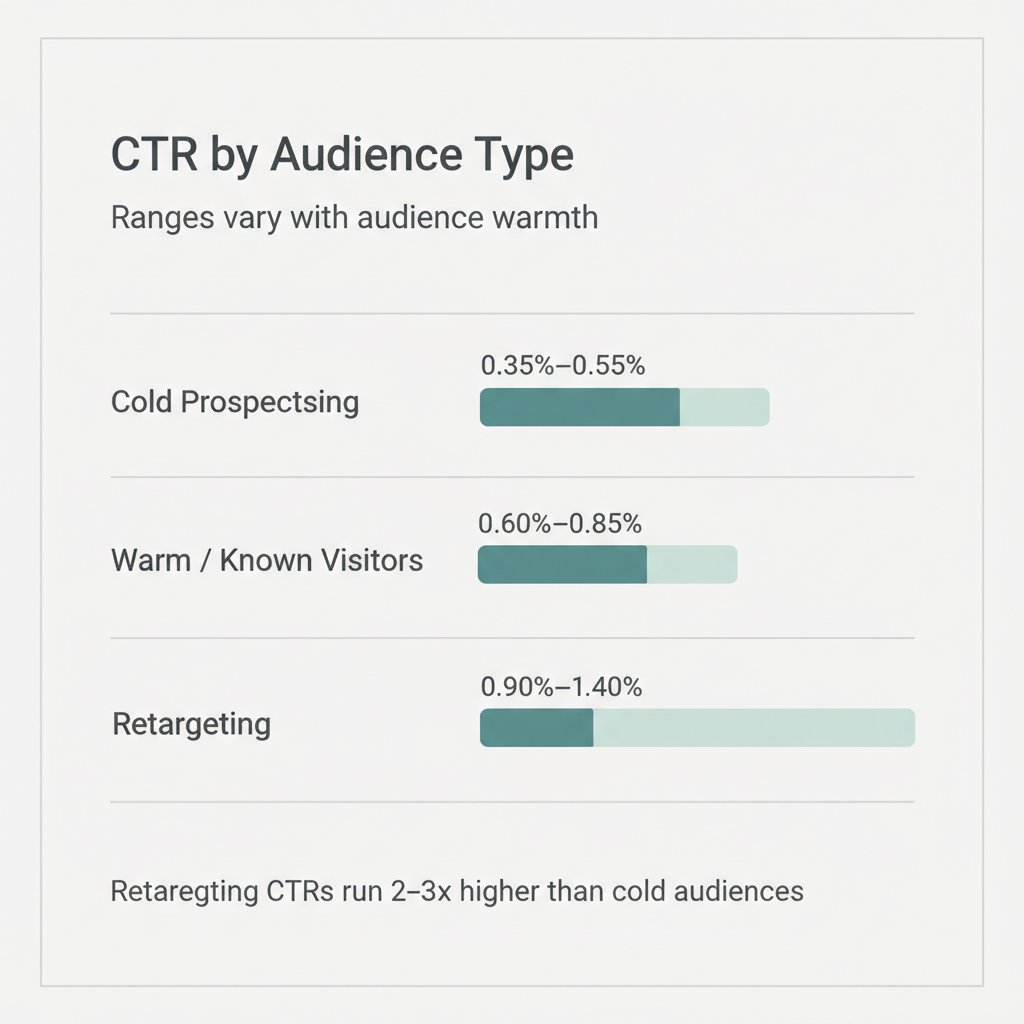
According to LinkedIn internal data:
Audience Type | CTR Range |
Cold Prospecting | 0.35% - 0.55% |
Warm/Known Visitors | 0.60% - 0.85% |
Retargeting | 0.90% - 1.40% |
Retargeting CTRs run 2-3x higher than cold-audience CTRs-even a tiny retargeting audience can dramatically improve efficiency. Learn more about building effective retargeting workflows in our LinkedIn Insight Tag guide.
ABM Campaign CTR
Account-based marketing campaigns targeting specific companies show unique patterns. 2026 ABM benchmark data reveals:
Performance Level | CTR |
Typical Company | 0.69% |
Top Performers (by pipeline) | 0.21% |
Interestingly, top performers by pipeline generated show lower CTR-they prioritize lead quality over click volume.
Why LinkedIn CTR Is Lower Than Other Platforms
LinkedIn's lower CTR compared to Facebook or display advertising isn't a weakness-it reflects platform dynamics:
Professional Context: Users browse LinkedIn for work-related purposes. They're more selective about what earns their click.
Higher Intent Clicks: Each click represents genuine interest from a professional decision-maker, not casual browsing.
Quality Over Quantity: A 0.5% CTR from verified VPs of Marketing is worth more than a 2% CTR from a general consumer audience. For a detailed comparison, read our analysis of LinkedIn ads vs Facebook ads.
How to Improve Your LinkedIn CTR
Optimize Ad Creative
Strong creative drives CTR improvements of 2-3x according to industry analysis:
- First line hook: Capture attention in the first 150 characters
- Clear value proposition: Explain what the reader gains
- Visual contrast: Use bold colors and clean design
- Specific numbers: Concrete results outperform vague claims
Match Format to Objective
Different formats optimize for different CTR profiles:
Objective | Best Format | Expected CTR |
Brand Awareness | Video Ads | 0.25-0.40% (focus on views) |
Lead Generation | Document Ads | 0.50-0.75% |
Website Traffic | Single Image | 0.50-0.80% |
Engagement | Thought Leader Ads | 2.5-3.5% |
Refine Targeting
Narrow targeting often improves CTR by reaching more relevant audiences:
- Layer job function + seniority + industry
- Exclude irrelevant job titles
- Test company size segments separately
- Use retargeting audiences whenever possible
Implement Frequency Capping
Over-exposure tanks CTR. LinkedIn's 2026 guidance recommends:
- Sponsored Content: Max 3-4 impressions per day
- Message Ads: Max 1-2 per 30 days
- Weekly cap: 18-22 total impressions per user
Exceeding these limits causes relevance scores to drop and CPCs to rise 40-80% within 48 hours.
CTR vs. Other Metrics: What Actually Matters
CTR is just one performance indicator. For B2B campaigns, these metrics often matter more:
Cost Per Qualified Lead (CPQL): A higher CTR is meaningless if clicks don't convert to qualified leads.
MQL-to-SQL Rate: LinkedIn typically delivers 20-30% MQL-to-SQL rates versus 8-15% on other platforms.
Pipeline Influenced: The ultimate measure-how much revenue did your LinkedIn campaigns influence?
According to B2B marketing experts, LinkedIn is a quality traffic channel, not a cheap one. Use it for persuasion, not click-chasing.
Creative Patterns That Move CTR
Benchmarks tell you where you stand; creative is what actually moves the number, and a few patterns recur across high-CTR LinkedIn campaigns. Lead with a specific, quantified claim in the first line -- "cut onboarding 40%" beats "improve onboarding" -- because the feed rewards concrete value over abstraction. Use a single human face making eye contact rather than a logo or abstract graphic; authentic member photos consistently out-perform stock by roughly 3x on engagement. Keep the visual uncluttered with one bold accent color that stands out against LinkedIn's predominantly white and blue interface. For video, front-load the hook in the first three seconds and burn in captions, because most viewers watch without sound and the CTR lift from AI subtitles is well documented. Test four to five variants per campaign and judge only after 10,000 impressions so early noise does not bias the decision. The accounts that beat their format benchmark are not luckier; they treat creative as the primary CTR control and iterate on it deliberately.
Reading CTR Alongside the Full Funnel
A rising CTR is not inherently good if it pulls the wrong people, so interpret it inside the funnel rather than as a standalone score. A retargeting campaign at 1.2% CTR with a 15% conversion rate is healthy; a cold campaign at the same CTR with a 1% conversion rate may simply be attracting click-happy browsers. Compare CTR to cost per qualified lead and to pipeline influenced, because those are the metrics that survive contact with a CFO. When CTR climbs but CPL and win rate stay flat or worsen, you have likely improved bait, not audience -- tighten targeting rather than celebrating. Conversely, a "low" CTR on an ABM campaign that produces the highest pipeline is doing exactly its job. The discipline is to anchor CTR to a business outcome per campaign type, so the benchmark becomes a diagnostic signal rather than a grade, and you know whether to push for more clicks or stop chasing them.
Seasonality and Auction Pressure on CTR
CTR and the cost behind it move with the calendar, and ignoring that context produces false alarms. Q4 and major shopping periods tighten inventory as consumer and B2B advertisers compete, which depresses CTR and lifts CPC even when your creative is unchanged. Early-year periods often show the opposite, with cheaper auctions and slightly higher CTR as competitors pull back. Plan creative refreshes and budget shifts around these cycles rather than reacting to a CTR dip in November as if it were a creative failure. Build a 12-month baseline of your own CTR by campaign type so you can separate seasonal drift from genuine performance problems, and avoid judging a single month against an annual average. The benchmarks in this guide are a cross-sectional snapshot; your own seasonally-adjusted trend line is the more honest reference for whether a campaign is actually underperforming.
Frequently Asked Questions
What Is a Good CTR for LinkedIn Ads?
A good CTR for LinkedIn sponsored content is 0.55-0.80%. Average sits around 0.44-0.65%. Excellent campaigns reach 0.80-1.30%+. Retargeting campaigns should aim for 0.90-1.40%. These benchmarks vary by ad format-Thought Leader Ads average 2.68-3.40% overall CTR.
Why Is My LinkedIn CTR So Low?
LinkedIn CTRs are naturally lower than other platforms due to the professional context. If you're below 0.40%, check creative quality, targeting precision, and ad relevance. Frequency capping issues can also tank CTR-ensure users aren't seeing your ads too often.
How Does LinkedIn CTR Compare to Facebook?
LinkedIn CTR (0.44% average) is lower than Facebook's typical B2B rates (0.90-1.5%). However, LinkedIn delivers higher-quality B2B leads with 20-30% MQL-to-SQL conversion versus 8-15% on Facebook. The lower CTR reflects more deliberate, higher-intent clicks from professional decision-makers.