
Understanding your TikTok advertising performance requires mastering the platform's reporting capabilities. With the right metrics, attribution settings, and reporting tools, you can identify what's working, optimize underperforming campaigns, and demonstrate ROI.
This guide covers TikTok's key advertising metrics, how to set up custom reports, attribution window considerations, and third-party tools that enhance measurement.
TikTok Ads Metrics Overview
TikTok Ads Manager provides comprehensive metrics across awareness, engagement, and conversion objectives.
Accessing Your Data
TikTok Ads Manager's Dashboard and Campaigns pages display performance data:
Dashboard view includes:
- Account overview with balance and spend
- Ad group status (active, partially delivering, not delivering)
- Performance metrics visualized as trends
- Top-performing ads and audience insights
- Operation logs for account activity
Campaigns page provides:
- Campaign, ad group, and ad level details
- Customizable columns for specific metrics
- Filtering by date range, status, and objectives
- Export functionality for deeper analysis
Metric Categories
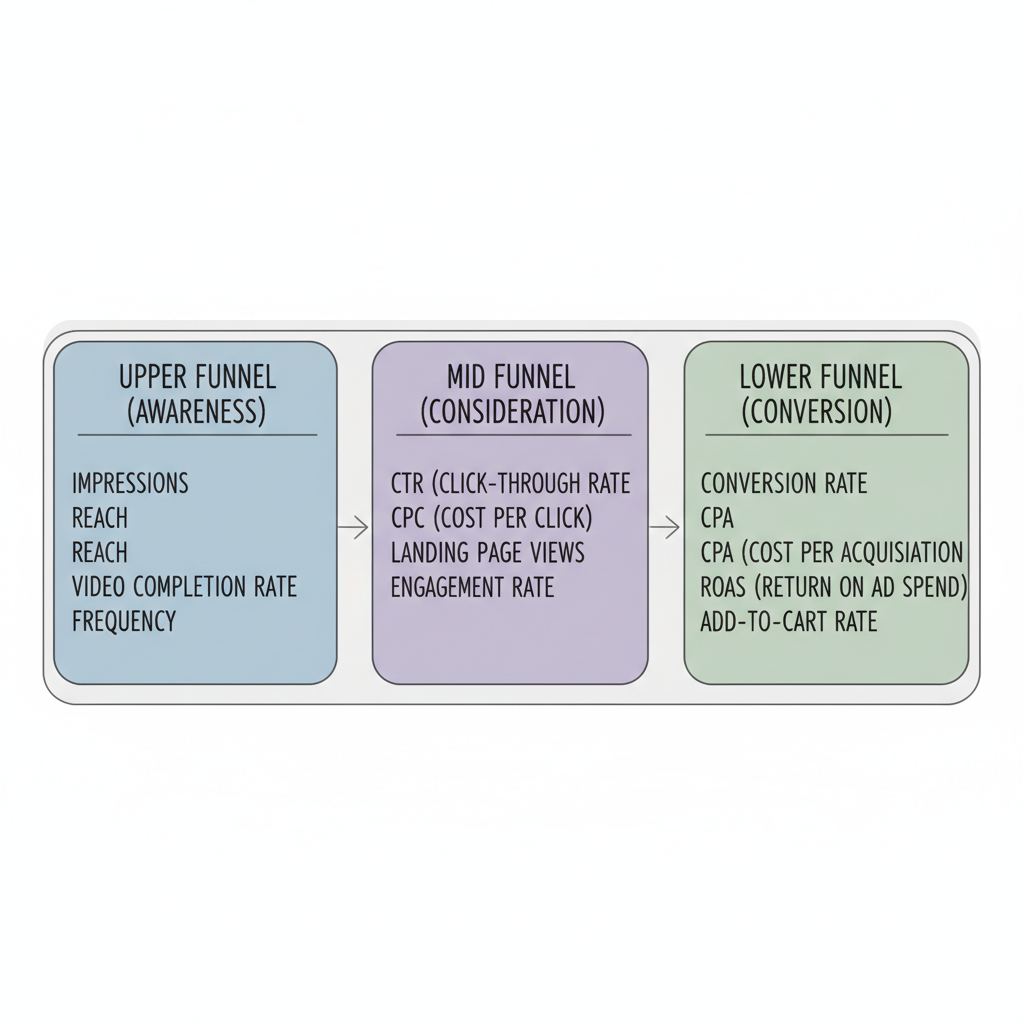
TikTok organizes metrics into three levels based on funnel stage:
Upper funnel (awareness):
- Impressions: Total ad views
- Reach: Unique users seeing ads (aim for 80%+ of impressions being unique)
- Video completion rate: Percentage watching entire ad
- Frequency: Average times each user saw your ad
Mid funnel (consideration):
- Click-through rate (CTR): Clicks / Impressions
- Cost per click (CPC): Ad spend / Clicks
- Landing page views: Users reaching destination
- Engagement rate: (Likes + Comments + Shares) / Impressions
Lower funnel (conversion):
- Conversion rate: Purchases / Clicks
- Cost per acquisition (CPA): Ad spend / Conversions
- Return on ad spend (ROAS): Revenue / Ad Spend
- Add-to-cart rate: For e-commerce campaigns
Key Performance Indicators
Understanding benchmarks helps evaluate whether your campaigns are performing well. For a deeper dive into performance expectations, see our complete TikTok advertising statistics 2026 breakdown.
2026 Benchmark Metrics
Current industry benchmarks for TikTok ads:
Metric | Good Performance | Exceptional |
CTR | 1.5%+ | 3%+ |
CPC | $0.50-$1.50 | Below $0.50 |
Video completion rate | 40%+ | 60%+ |
Engagement rate | 2%+ | 5%+ |
Conversion rate | 2-3% | 5%+ |
Cost Benchmarks by Industry
TikTok ad costs vary by vertical:
Industry | Avg. CPC | Avg. CPM | Expected ROAS |
E-Commerce & Retail | $0.50-$1.50 | $6-$12 | 2.0-4.0+ |
Beauty & Skincare | $0.50-$1.50 | $6-$12 | 0.91 |
Mobile Apps & Gaming | $0.50-$1.80 | $5-$10 | Varies |
B2B / SaaS | $1.50-$3.00 | $5-$12 | High LTV focus |
Home Goods | $0.40-$1.20 | $5-$10 | 4.2 |
Conversion Rate Benchmarks
Conversion rates differ by destination:
- Shopify/website traffic: 1.5%-3.5% CVR
- TikTok Shop: 3.0%-6.0% CVR
TikTok Shop sees significantly higher conversion rates due to reduced friction from in-app purchasing. If you're considering this channel, our guide on TikTok Shop marketing strategy 2026 covers best practices for maximizing performance.
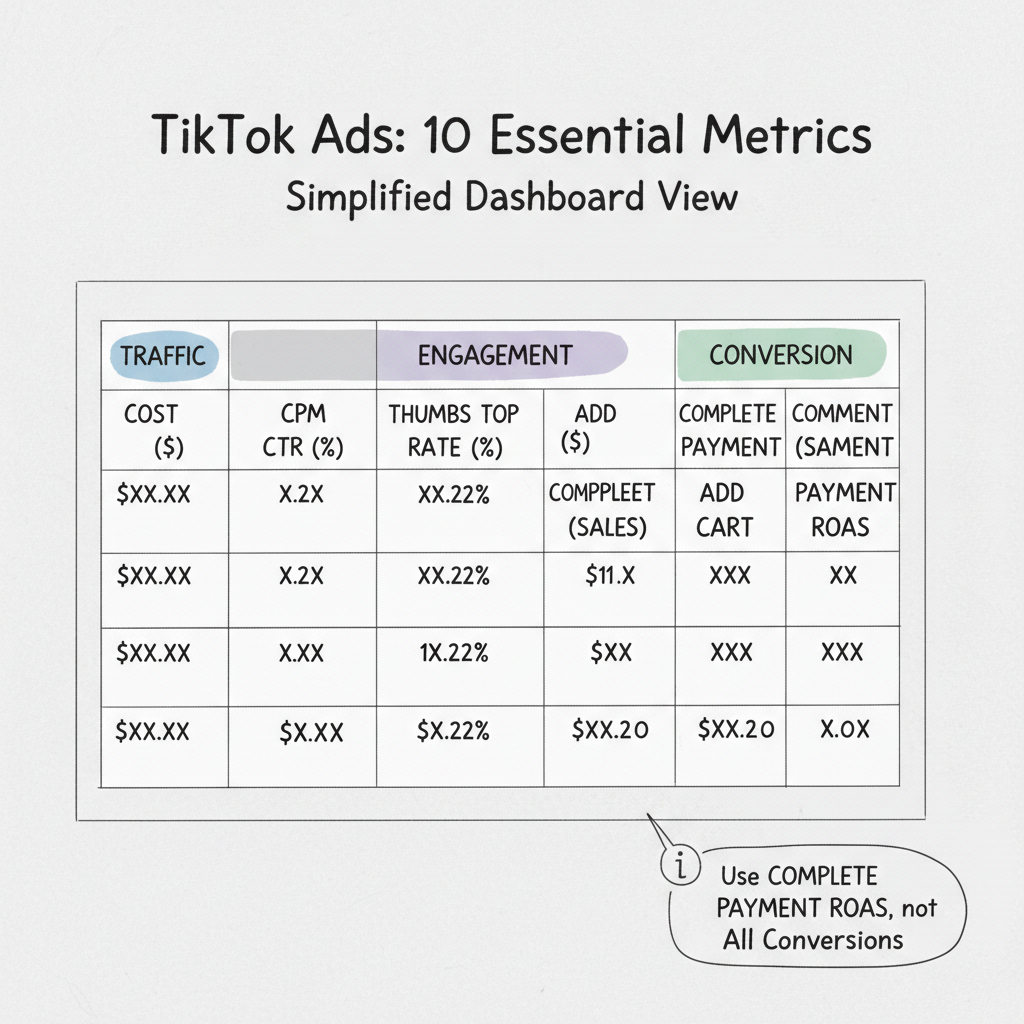
The Essential Metrics Dashboard
Recommended columns for your TikTok Ads Manager view:
- Cost (Spend)
- CPM (Cost of Traffic)
- CTR (Click Intent)
- Thumbstop Rate (2-Second View %)
- Engagement Rate
- CPC (Cost per Click)
- Add to Cart
- Complete Payment (Sales)
- Cost Per Complete Payment (CPA)
- Complete Payment ROAS
Important note: Ensure you're viewing Complete Payment ROAS, not All Conversions. TikTok sometimes bundles Add to Cart values into generic conversion columns if not configured correctly.
Custom Reports
TikTok Ads Manager allows building custom reports tailored to your specific needs.
Building Custom Reports
Access custom reporting:
- Navigate to TikTok Ads Manager
- Go to the Reporting section
- Select "Custom Report"
- Choose dimensions and metrics
- Set date ranges and filters
- Save and schedule reports
Useful dimensions:
- Campaign, ad group, ad level breakdown
- Day, week, month time granularity
- Placement breakdown (For You Feed, etc.)
- Audience demographics
- Device and OS
Report Templates by Objective
For awareness campaigns:
- Reach and frequency trends
- Video completion rates by creative
- CPM by audience segment
- Brand lift metrics (if running studies)
For traffic campaigns:
- CTR and CPC by ad creative
- Landing page view rate
- Bounce rate correlation (via pixel)
- Cost per landing page view
For conversion campaigns:
- CPA by audience and creative
- ROAS by campaign
- Conversion rate by funnel step
- Attribution by click vs. view
Scheduling and Automation
Set up automated reports:
- Daily delivery for active campaigns
- Weekly summaries for stakeholders
- Monthly performance overviews
- Custom alerts for metric thresholds
Reports can be exported as CSV or Excel for further analysis.
Attribution Windows
Attribution settings significantly impact how TikTok credits conversions to your ads.
Understanding Attribution
TikTok operates at the top of the funnel—creating awareness and interest that may convert days or weeks later through other channels. This makes attribution window settings critical.
Click-through attribution: Credits conversions to users who clicked your ad before converting. More reliable signal of direct intent.
View-through attribution: Credits conversions to users who saw (but didn't click) your ad before converting. Captures awareness influence.
Attribution Window Options
TikTok Ads Manager supports attribution windows up to 28 days:
Available settings:
- 1-day click, 1-day view
- 7-day click, 1-day view (common default)
- 28-day click, 7-day view (maximum)
Choosing the right window:
- Shorter windows (1-7 days): More conservative, higher confidence
- Longer windows (14-28 days): Captures more conversions, includes delayed purchases
- Match to your typical purchase consideration period
The Attribution Challenge
Last-click attribution systematically under-credits TikTok's contribution because users often discover products on TikTok but purchase through other channels later.
Solutions:
- Use multi-touch attribution tools
- Run incrementality tests
- Compare blended CAC across all channels
- Track branded search lift after campaigns
Third-Party Reporting Tools
Native TikTok analytics can be enhanced with third-party tools for deeper insights.
TikTok Pixel and Events API
Proper tracking setup is foundational for accurate reporting:
TikTok Pixel benefits:
- Tracks website actions like views, adds-to-cart, and purchases
- Enables optimization for conversions
- Builds retargeting audiences
- Provides conversion attribution
Understanding TikTok retargeting and remarketing strategies can help you maximize the value of your pixel data.
Events API (server-side tracking):
- More reliable than pixel-only tracking
- Bypasses browser limitations
- Improves match rates
- Pair Pixel + Events API with deduplication using event_id
Analytics Platforms
Popular third-party tools for TikTok reporting:
AgencyAnalytics:
- White-labeled dashboards
- Multiple client account management
- TikTok Ads integration
- Cross-platform reporting
Metricool:
- Scheduling and analytics in one platform
- Competitor tracking
- Retention curve analysis
- Follower growth over time
Socialinsider:
- Deep social media analytics
- Influencer analytics
- Competitor campaign analysis
- Multi-platform comparison
Attribution and Analytics Suites
Triple Whale:
- Multi-touch attribution
- Cross-platform ROAS tracking
- Customer journey visualization
- First-party data backbone
Attribuly:
- Multi-touch attribution validation
- Server-side signal integration
- Meta, Google, and TikTok connection
- Deduplication management
TikTok'S Partner Integrations
TikTok integrates with third-party measurement partners:
- AppsFlyer: Mobile app attribution
- Adjust: Cross-platform measurement
- Branch: Deep linking and attribution
- Kochava: Mobile measurement
These partners enable measurement of impressions, clicks, and in-app events across campaign objectives.
Making Data Actionable
Reporting is only valuable when it drives decisions.
Weekly Optimization Cadence
Week 1 after launch: Monitor delivery and early engagement metrics. Ensure ads exit learning phase (50+ conversions).
Week 2: Identify top-performing creatives. Pause underperformers, allocate budget to winners.
Ongoing: Test new creative concepts weekly. Refresh audiences as performance plateaus. Adjust bids based on competitive dynamics. If you encounter issues with campaign delivery, our TikTok ads not spending troubleshooting guide can help diagnose the problem.
Kill/Scale Decisions
Use CPA as your primary kill/scale metric. If CPA exceeds your break-even point for more than 3 days, pause the ad group.
Diagnostic framework:
- High CPA + high CTR = Landing page or pricing issue
- High CPA + low CTR = Creative is the problem
- High CPA + low volume = Audience too narrow
Frequently Asked Questions
What Metrics Should I Track for TikTok Ads?
Focus on metrics aligned with your objective. For awareness, track reach, video completion rate, and CPM. For consideration, monitor CTR, CPC, and engagement rate. For conversions, prioritize CPA, ROAS, and conversion rate. Always track Complete Payment ROAS rather than all conversions to ensure accuracy.
What Is a Good ROAS for TikTok Ads?
ROAS varies by industry. E-commerce typically sees 2.0-4.0x, beauty around 0.91x (lower due to longer consideration), and home goods often achieve 4.2x. A strong general benchmark is 3:1 or higher, but acceptable ROAS depends on your profit margins—higher margin products can profit at lower ROAS.
How Do I Set Up Proper TikTok Tracking?
Install TikTok Pixel on your website and pair it with Events API for server-side tracking. Configure standard events (ViewContent, AddToCart, Purchase) and use event_id for deduplication between pixel and API. Set appropriate attribution windows based on your typical purchase cycle—7-day click, 1-day view is a common starting point.