
TikTok has evolved from a viral video app to a dominant force in digital advertising. Understanding the platform's current statistics helps marketers make informed decisions about budget allocation, targeting, and strategy.
This guide compiles the most important TikTok advertising statistics for 2026, covering user growth, ad spend, engagement metrics, and e-commerce performance.
TikTok User Statistics
TikTok's user base continues growing, making it one of the most valuable advertising platforms available.
Global User Numbers
Metric | 2026 Data |
Global monthly active users | Nearly 2 billion (projected 2.13 billion by end of 2025) |
Platform ranking | #4 or #5 worldwide (trailing Facebook, YouTube, Instagram, WhatsApp) |
Countries with 100M+ users | U.S., Indonesia, Brazil |
Annual app downloads | 875 million in 2024 |
Time Spent on Platform
TikTok leads all social platforms in user engagement time:
Metric | Statistic |
Average daily time spent | 95 minutes per user - highest among all social platforms |
Average session length | 10 minutes 51 seconds |
Average daily opens (U.S.) | 8 times per day |
This sustained attention creates multiple daily opportunities to reach users with advertising.
User Demographics
TikTok's audience continues to diversify beyond its early Gen Z focus:
- Platform demographics shifting with rising male dominance
- Expanded audience ranging from teens to adults 35+
- Global reach across developed and emerging markets
- 90% of worldwide users access TikTok daily
Ad Spend Statistics
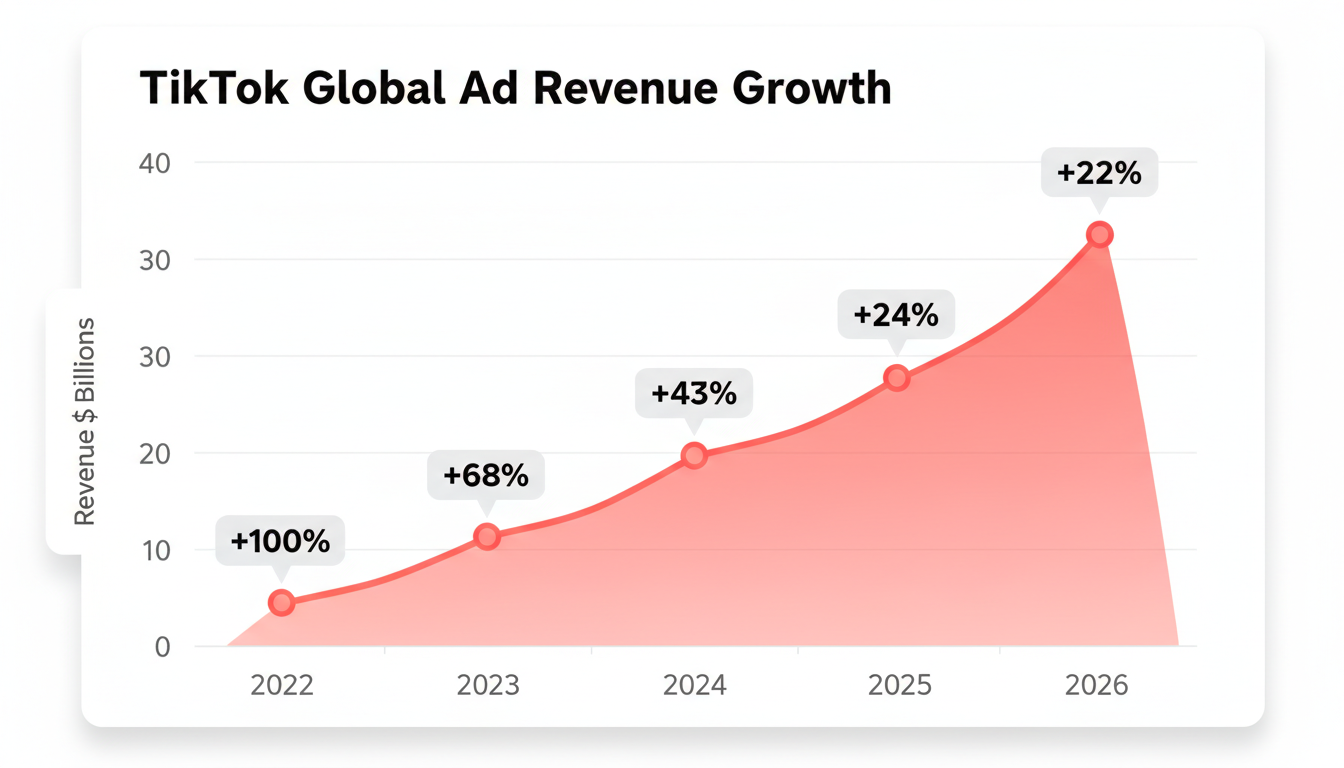
TikTok advertising spend has grown dramatically, with projections showing continued acceleration. Brands implementing a comprehensive TikTok advertising strategy have seen significant returns on their investment.
Revenue Growth
Year | Revenue | YoY Growth |
2026 (projected) | $34.8 billion global | 22% |
2025 | $28.6 billion | 24% |
2024 | $23 billion | 43% |
2023 | $16.1 billion | 68% |
2022 | $9.6 billion | 100% |
U.S. Market
The U.S. represents a significant portion of TikTok's advertising revenue:
- U.S. TikTok ad revenue: $17.17 billion (2026 projected)
- 26% year-over-year growth - 4x faster than total media industry
- Share of social ad spend: 12-15% and rising
Marketer Adoption
Metric | Percentage |
Marketers using TikTok (2024) | 28% globally |
B2C brands using TikTok | 39% |
B2B brands using TikTok | 23% |
Marketers planning to increase TikTok spend | 43% |
Engagement Statistics
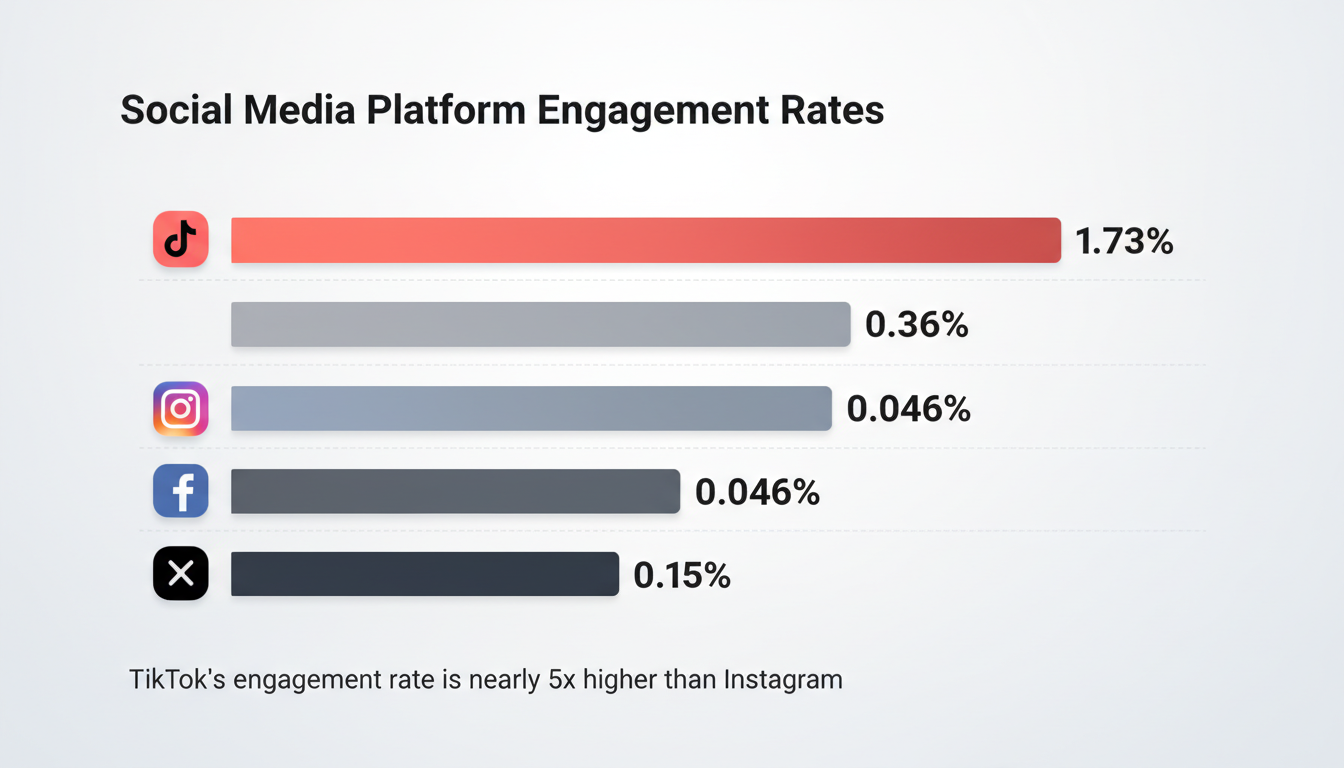
TikTok's engagement metrics significantly outperform other social platforms.
Platform Comparison
Platform | Median Engagement Rate |
TikTok | 1.73% |
0.36% | |
0.046% | |
X (Twitter) | 0.015% |
TikTok's engagement rate is nearly 5x Instagram's and over 37x Facebook's. Understanding how the TikTok algorithm works is crucial for maximizing these engagement opportunities.
Engagement by Account Size
Engagement varies by follower count:
Account Size | Engagement Rate |
Accounts with 100K+ followers | 5.3% |
General benchmark | 2.5-6% per post |
Key Engagement Metrics
- Videos uploaded: 16,000+ per minute
- Engagement rate 2%+ is considered good; 5%+ is excellent
- Video completion rate: 40%+ is strong
E-Commerce Statistics
TikTok Shop has emerged as a major e-commerce platform, transforming how users discover and purchase products. Marketers developing a TikTok Shop marketing strategy can tap into this growing revenue stream.
TikTok Shop Performance
Metric | 2026 Data |
TikTok Shop sales forecast | Exceeding $20 billion |
Projected 2028 sales | $30+ billion |
Global GMV (2024) | $33 billion |
U.S. GMV (2024) | $9 billion |
Commerce Behavior
TikTok drives significant e-commerce activity:
- 59% of weekly users have engaged in e-commerce behaviors on the platform
- 50% of U.S. social shoppers will make purchases on TikTok in 2026
- Daily purchases from Americans exceed $32 million
- 79.3% of purchases come from health and beauty products
Global TikTok Shop Distribution
Country | Share of TikTok Shops |
Indonesia | 20.5% |
Thailand | 18.3% |
Vietnam | 17% |
United States | 11.8% |
United Kingdom | 6.19% |
Industry Benchmarks
Understanding performance benchmarks helps set realistic campaign expectations. For e-commerce brands, implementing TikTok ads for dropshipping requires careful attention to these metrics.
Ad Performance Metrics
Metric | Benchmark |
Click-through rate (CTR) | 1.5-3% (1.5%+ solid, 3%+ exceptional) |
Cost per click (CPC) | $0.50-$1.50 |
Engagement rate | 2%+ good, 5%+ excellent |
Video completion rate | 40%+ is strong |
Add-to-cart rate | 5-10% from clicks is strong |
ROI Statistics
TikTok advertising delivers strong returns for many advertisers:
- 96% higher ROAS compared to other digital channels
- 2x stronger efficiency than television advertising
- 51% of brands report positive ROI
- 45% of brands achieve break-even on ad spend
Engagement by Industry
Top-performing industries on TikTok:
Industry | Engagement Rate |
Higher education | 7.36% |
Nonprofits | 3.04% |
Travel | 2.73% |
Sports teams | 2.68% |
Food and beverage | 2.04% |
Creator Economy Statistics
The creator ecosystem powers much of TikTok's advertising effectiveness.
Creator Numbers
Metric | Statistic |
Active creators globally | 127 million (19% growth since early 2025) |
Nano influencers (1K-10K followers) | 67.15% of creator base |
Top creator follower count | Khaby Lame: 160+ million |
Creator Economics
- Creator Rewards Program pays $0.40-$1.00+ per 1,000 views
- Top 10% of creators earn average of $48,500 per month
- 48% of brands now consider creators a "standard media channel"
Future Projections
TikTok's trajectory suggests continued growth and importance for advertisers.
Growth Forecasts
- Projected 1.9 billion active users by 2029
- TikTok Shop expected to surpass $30 billion by 2028
- Creator economy doubled from $13.9B (2021) to $29.5B (2024)
- $37 billion in U.S. creator economy ad spend (2025)
Platform Trends
- Increasing integration of commerce and content
- Algorithm-driven discovery continues to differentiate platform
- Growing B2B adoption alongside established B2C presence
- Expanded demographic reach beyond core Gen Z audience
How to Use These Statistics in Planning
Benchmarks are starting points, not targets. If your category engagement sits below the 2% good line, check creative hook and sound-off captioning before assuming the platform is wrong for you. Use the CPC and CTR ranges to set realistic test budgets and to spot waste early.
Map the regional TikTok Shop splits to your own market before committing commerce spend. A brand selling in the U.S. should weight the 11.8% U.S. share and the $9 billion GMV context, not the Indonesia-led totals, when forecasting contribution from the channel.
Attribution and Measurement Notes
Self-reported ROAS and brand surveys overstate TikTok's bottom-line impact because they credit the last touch. Connect campaign data to your CRM and watch assisted conversions, especially for products with a research phase before purchase.
Track video completion and add-to-cart alongside CTR. A high CTR with weak completion means the hook lies; strong completion with low cart rate means the offer or landing page needs work. Reading the pair tells you which lever to pull next.
Caveats on the 2026 Numbers
Several figures here are projections from late-2025 models and will shift as the year unfolds. Treat directional trends - rising ad revenue, growing TikTok Shop, expanding demographics - as durable, but re-check exact percentages before quoting them in a board deck.
Also note that engagement rates vary sharply by account size and industry; the platform medians hide wide ranges. Benchmark your campaign against the closest industry row above, not the blended average, to avoid misreading performance.
Frequently Asked Questions
How Many People Use TikTok in 2026?
TikTok has nearly 2 billion monthly active users globally, with projections reaching 2.13 billion. The platform ranks #4 or #5 among social media platforms worldwide, with over 100 million users each in the U.S., Indonesia, and Brazil. The average user spends 95 minutes daily on the app.
What Is the Average Engagement Rate on TikTok?
TikTok's median engagement rate is 1.73%, significantly higher than Instagram (0.36%), Facebook (0.046%), and X (0.015%). Accounts with over 100,000 followers see engagement rates around 5.3%. For ads, engagement rates of 2%+ are considered good, while 5%+ is excellent.
How Much Does TikTok Make from Advertising?
TikTok's global ad revenue is projected to reach $34.8 billion in 2026, with U.S. ad revenue alone exceeding $17 billion. The platform has grown from $4.8 billion in 2021 to $28.6 billion in 2025, representing year-over-year growth rates consistently above 20%.