
Facebook Ads vs Google Ads Cost: Complete Comparison (2026)
Choosing between Facebook ads and Google ads often comes down to one question: which platform gives you more value for your advertising budget? While both platforms can drive results, their cost structures differ significantly based on how users interact with each.
This facebook ads vs google ads cost comparison breaks down the real costs in 2026, including CPC, CPM, and cost per lead benchmarks to help you allocate your budget effectively.
To make the most of your Facebook ad budget, sharpen your skills with our free Meta Ads course covering campaign optimization and cost management.
CPC Comparison: Facebook vs Google Ads
Cost per click is often the first metric advertisers compare, and here the difference is substantial. Understanding facebook ads cost per click is essential when planning your campaign budget.
Facebook Ads CPC
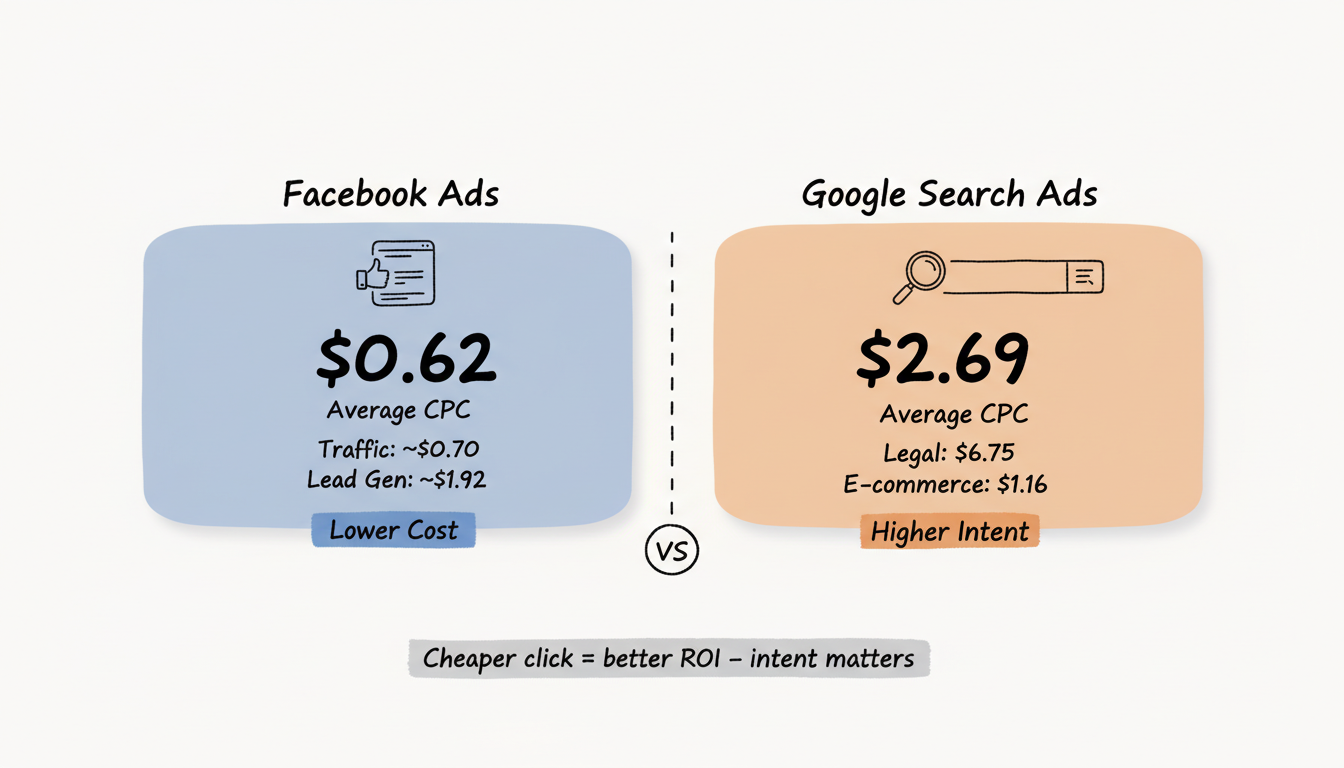
Facebook\'s average CPC is $0.62, based on 2024-2025 data from WordStream, Revealbot, and Statista — one of the lowest among major ad platforms. See our complete guide to Facebook Ads cost.
However, CPC varies considerably by campaign objective:
- Traffic campaigns: approximately $0.70
- Lead generation campaigns: approximately $1.92
- Conversion campaigns: $1.00-$2.00+ depending on industry
Google Ads CPC
Google Search ads have a significantly higher average CPC at $2.69 across industries, with some sectors paying much more. Many businesses work with a facebook ads management agency to optimize their campaigns and reduce costs across platforms.
Industry | Google Search CPC |
Legal | $6.75 |
Consumer Services | $6.40 |
Finance & Insurance | $3.44 |
Technology | $3.80 |
E-Commerce | $1.16 |
Travel & Hospitality | $1.53 |
Source: WordStream industry benchmarks
The Google Display Network offers lower CPCs at an average of $0.63, more comparable to Facebook’s costs.
Google’s Performance Max (PMax) campaigns, which blend Search, Display, YouTube, Shopping, and Discovery inventory into a single automated campaign, have added another cost dimension. PMax CPCs tend to run 15-30% lower than standard Search campaigns because they include cheaper Display and YouTube clicks in the mix. However, isolating true Search performance within PMax is difficult, making direct CPC comparisons less straightforward. For advertisers primarily focused on Search, standard Search campaigns still offer more control over cost and targeting.
The CPC Verdict
Facebook ads are typically cheaper per click. However, Google Search clicks often represent higher purchase intent, which can justify the higher cost. A user searching “buy running shoes” on Google is further along the buying journey than someone scrolling Instagram who sees a shoe ad.
Key insight: Facebook averages $0.62 CPC vs Google Search at $2.69 CPC — cheaper clicks don't always mean better returns. Purchase intent determines true value.
How Do You Lower Your Google Ads CPC?
Lower Google Ads CPC by improving your Quality Score through better landing page relevance and expected CTR. A Quality Score of 8-10 can reduce CPC by 30-50% versus a score of 3-5.
What Is the Average Facebook CPC by Industry?
Facebook CPC ranges from $0.30 in apparel to $3.77 in finance. B2B industries typically see higher CPCs ($2-$5) while e-commerce and entertainment often achieve sub-$1 CPCs.
What Bidding Strategy Lowers Facebook Ads Cost?
Cost Cap bidding lets you set a maximum CPA target on Facebook. For most advertisers, Lowest Cost bidding generates the most conversions while Cost Cap maintains efficiency at scale.
Which Google Ads Bidding Strategy Reduces CPC?
Enhanced CPC and Maximize Clicks can lower average CPC in competitive auctions. Target Impression Share bidding helps brand-focused campaigns win placements without overbidding.
Does Facebook CPC Reflect Purchase Intent?
Facebook CPC reflects interruption-based ad clicks, not search intent. Lower CPC on Facebook often comes with lower purchase intent — meaning more clicks are needed to generate the same conversions as Google Search.
How Much Can Quality Score Reduce Your CPC?
A Quality Score of 10 can reduce CPC by up to 50% versus a score of 5 in the same auction. Investing in landing page relevance and ad copy alignment directly lowers your cost to compete.
What Is Facebook Ad Relevance Score and How Does It Affect Cost?
Facebook replaced its single relevance score with three metrics: quality ranking, engagement rate ranking, and conversion rate ranking. Above-average rankings lower CPM and increase delivery efficiency for your ads.
CPM Comparison: Reach and Brand Awareness
Cost per thousand impressions (CPM) matters most for awareness campaigns where you’re optimizing for reach rather than clicks. When evaluating facebook ads cost per impression, you’ll need to consider both placement and targeting.
Facebook Ads CPM
Facebook’s average CPM is $11.62, with Meta CPM benchmarks showing ranges between $8 and $14 depending on your market and targeting.
Instagram CPM runs slightly higher at approximately $12.19, though both platforms are managed through the same Ads Manager. If you’re running campaigns on multiple platforms, you might wonder whether you can run ads instagram without facebook entirely.
Facebook Average Cost per Impression in 2026
For advertisers planning brand awareness campaigns in 2026, the average cost per impression on Facebook breaks down as follows:
- Feed placements: $0.010-$0.014 per impression ($10-$14 CPM)
- Stories and Reels: $0.008-$0.012 per impression ($8-$12 CPM)
- Audience Network: $0.003-$0.006 per impression ($3-$6 CPM)
- Right column: $0.005-$0.009 per impression ($5-$9 CPM)
These rates represent the cost for Meta/Facebook advertising impressions based on 2025-2026 benchmark data from WordStream, Revealbot, and industry reports. Brand awareness campaigns optimized for reach typically achieve the lowest per-impression costs, while conversion-optimized campaigns pay a premium for higher-quality impressions.
Google Ads CPM
Google’s CPM varies dramatically by network:
- Google Display Network: $3.12 average CPM—significantly cheaper than Facebook for pure impressions
- YouTube: $4-$10 CPM range, competitive with Meta platforms
For broad reach at the lowest cost per impression, Google Display wins. But impressions on display networks are often less impactful than in-feed social placements.
The CPM Verdict
Google Display offers cheaper impressions, but Facebook and Instagram placements typically drive better engagement and recall. Facebook Reels, video, and story placements deliver excellent reach while keeping CPMs competitive.
Video Ad Cost Benchmarks: YouTube vs Facebook and Instagram
Video advertising costs differ substantially between platforms, and the rise of short-form video placements has changed the landscape in 2026.
YouTube video ad costs:
- TrueView in-stream (skippable): $0.010-$0.030 per view, $4-$10 CPM
- YouTube Shorts ads: $2-$6 CPM, competitive with social platforms
- Bumper ads (6 seconds, non-skippable): $6-$12 CPM
- Non-skippable in-stream (15 seconds): $10-$20 CPM
Facebook and Instagram video ad costs:
- Feed video ads: $10-$16 CPM, higher than static image ads in most cases
- Reels placements: $4-$8 CPM, currently the most cost-efficient video format on Meta
- Stories video ads: $6-$10 CPM
- In-stream video (Audience Network): $3-$7 CPM
For advertisers prioritizing video reach at the lowest cost, Facebook and Instagram Reels and YouTube Shorts offer the best CPMs in 2026. Traditional in-feed video placements cost more but typically deliver stronger engagement metrics. When comparing platforms for video campaigns specifically, YouTube provides more granular placement control, while Meta offers easier creative scaling across Reels, Stories, and Feed simultaneously.
How Do You Reduce Facebook CPM?
Reduce Facebook CPM by improving your ad relevance score and targeting more specific audiences. Expanding to automatic placements (Reels, Stories, Audience Network) often yields lower CPMs than feed-only campaigns.
How Does Google Display CPM Compare to Search CPC?
Google Display Network averages $2-$5 CPM, significantly cheaper than Search CPCs. Display works best for remarketing and awareness; Search is better for capturing high-intent purchase decisions.
What Is the Difference Between Vcpm and CPM?
vCPM (viewable CPM) charges only when an ad is actually seen, unlike standard CPM billed on impressions. Google's viewable CPM typically costs 15-25% more than standard CPM but delivers measurably higher brand recall.
Which Platform Reaches More People: Facebook or Google?
Google reaches approximately 90% of global internet users through Search and Display. Facebook reaches over 3 billion monthly active users. Both offer massive scale — the right choice depends on targeting precision, not just reach.
What CPM Should You Expect for Brand Awareness Campaigns?
Brand awareness campaigns average $5 to $15 CPM on Facebook and $2 to $8 CPM on Google Display. YouTube pre-roll ads average $10 to $30 CPM, with stronger brand recall metrics than static banner formats.
CPL Comparison: Cost per Lead
For lead generation campaigns, cost per lead is the metric that matters most. Before launching campaigns, use a facebook ads cost calculator to estimate your budget needs.
Facebook Ads CPL
Facebook’s average cost per lead ranges from $10 to $50+ depending on industry. The platform’s Lead Ads feature with native forms can reduce CPL significantly compared to landing page conversions.
Benchmark CPL by business type:
- E-commerce: $10-$25
- B2B services: $30-$75
- Professional services: $40-$100+
For specialized industries like e-commerce, partnering with an ecommerce facebook ads agency can help optimize lead costs and conversion rates.
Google Ads CPL
Google Ads CPL varies widely, with averages ranging from $70 for B2C leisure businesses to $819 for B2B manufacturing.
The average CPA for Google search ads is $48.96, while display ads average $75.51 per action.
Industry-specific Google Ads CPL:
- Legal: $150-$300+
- Financial services: $80-$150
- Healthcare: $50-$100
- E-commerce: $30-$60
The CPL Verdict
When comparing facebook ads vs google ads cost per lead, Facebook generally delivers lower CPLs for awareness-stage leads. But lead quality matters: Google Ads excels for high-intent conversions because users actively searched for solutions, while Facebook leads may require more nurturing.
Lead Quality Comparison: Conversion Rates by Platform
Cost per lead only tells half the story. The quality of leads—measured by how often they convert into paying customers—varies significantly between platforms.
Google Search leads typically convert at higher rates because users arrive with explicit purchase intent:
- Google Search average conversion rate: 3.1%-5.2% depending on industry
- Google Display average conversion rate: 0.5%-1.2%
- Facebook Lead Ads average conversion rate: 1.0%-2.5%
- Facebook conversion campaigns: 1.5%-3.0% for warm audiences, 0.5%-1.5% for cold audiences
When you factor in lead quality, the effective cost per customer acquisition often narrows the gap between platforms. For example, a $50 Google lead that converts at 4% costs $1,250 per customer. A $25 Facebook lead that converts at 1.5% costs $1,667 per customer. The cheaper lead is not always the cheaper customer.
To get the most accurate picture, track cost per customer (not just cost per lead) across both platforms using consistent attribution windows.
What Is a Good Lead Form Conversion Rate on Facebook?
Facebook Lead Ads average a 10-12% conversion rate, significantly higher than website landing pages at 2-5%. Pre-filled form fields using Facebook profile data reduce friction and drive higher submission rates.
Do Google Call-Only Ads Lower Cost per Lead?
Google Call-Only Ads often deliver 20-40% lower CPL for service businesses, as phone leads close faster than form leads. They work best when your audience converts better by speaking to a salesperson directly.
ROI Comparison: Which Platform Delivers Better Returns?
The facebook ads vs google ads cost comparison does not end at CPC or CPL. What affects ROI most is lead quality, customer lifetime value, and post-click conversion rates. Tracking your facebook ads roi accurately is crucial.
Facebook Ads ROAS
Well-optimized Facebook campaigns often achieve 3:1 to 5:1 ROAS. The platform excels at:
- Building awareness and remarketing audiences
- Visual product discovery for e-commerce
- Reaching specific demographics and interests
- Retargeting, which remains one of the most cost-effective strategies
Understanding how to increase roi facebook ads can help you maximize returns on both platforms.
Google Ads ROAS
The median ROAS for Google Ads is approximately 3.5:1, meaning $3.50 returned for every $1 spent.
Google strengths include:
- Capturing high-intent search traffic ready to buy
- Local service businesses seeking immediate leads
- B2B with longer sales cycles where search intent signals qualification
ROI Reality Check
Neither platform is universally “better” for ROI. The right choice depends on your business model. To understand true performance, many advertisers use a facebook ads roi calculator that accounts for lifetime customer value.
Bottom line: Median ROAS is comparable — Facebook 3-5:1 vs Google 3.5:1 for well-optimized campaigns. The winner depends on your funnel, not the platform alone.
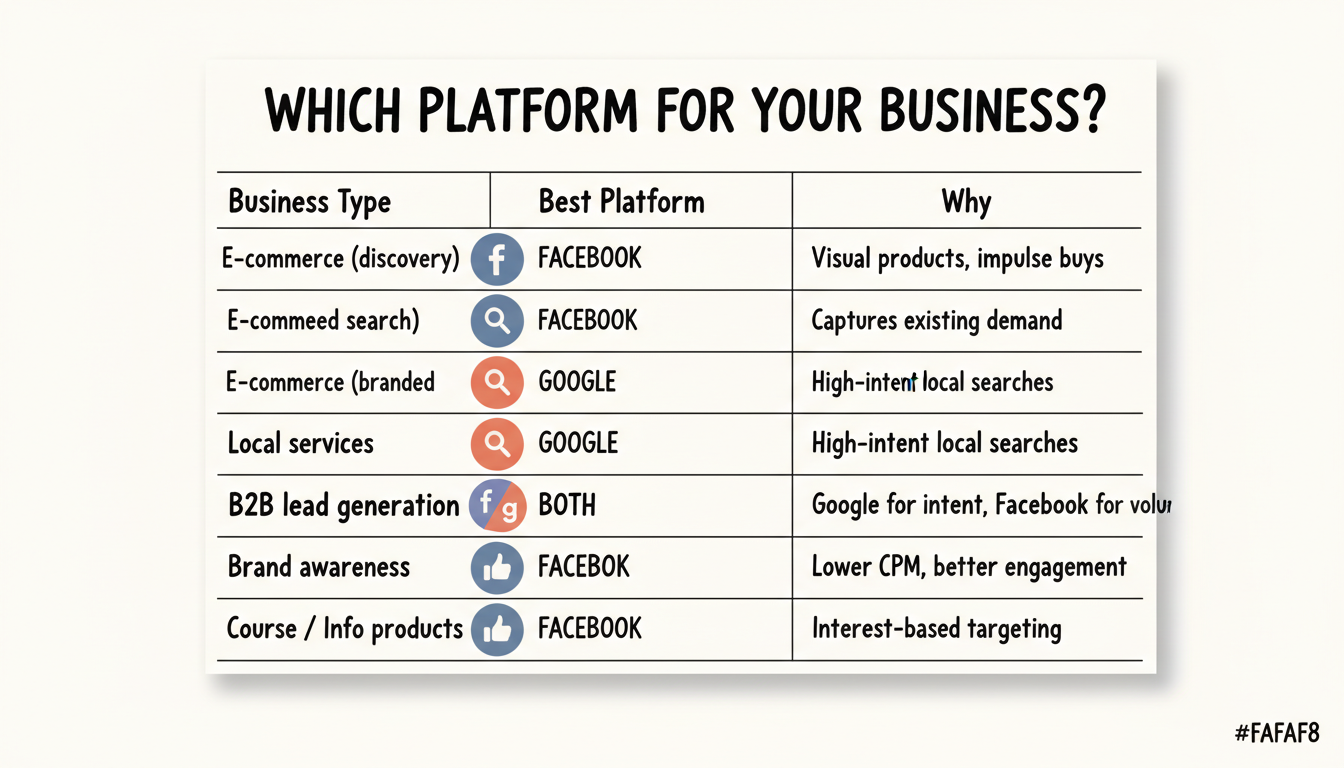
Business Type | Better Platform | Why |
E-commerce (discovery) | Visual products, impulse purchases | |
E-commerce (branded search) | Captures existing demand | |
Local services | High-intent local searches | |
B2B lead generation | Both | Google for high intent, Facebook for volume |
Brand awareness | Lower CPM, better engagement | |
Course/info products | Interest-based targeting works well |
How Do You Track Facebook Ads ROAS Accurately?
Track Facebook ROAS using the Meta Pixel with purchase events and verified conversions. Compare Meta-reported ROAS against your CRM or backend data to account for attribution differences.
What Is a Good Target ROAS for Google Ads?
A 3:1 to 5:1 ROAS is a solid starting target for Google Ads. High-margin products can profitably run at 2:1, while low-margin goods may need 8:1 or higher to stay profitable.
How Does Multi-Touch Attribution Affect Reported ROI?
Multi-touch attribution distributes credit across all touchpoints, typically lowering reported ROAS for each platform. Last-click attribution inflates the platform where conversions are measured, often overstating Google Ads performance.
What ROI Can You Expect Running Both Platforms Together?
Brands running both Facebook and Google Ads typically see 15-25% higher overall ROAS than single-platform strategies. The platforms complement each other — Facebook builds awareness, Google captures the resulting search demand.
How Long Until You See ROI from Facebook vs Google Ads?
Google Ads can show ROI within 1-2 weeks for search campaigns. Facebook Ads typically require 2-4 weeks for the algorithm to optimize, making early results a poor indicator of long-term performance.
How Does Customer Lifetime Value Affect Platform ROI?
High-LTV businesses like SaaS can afford $200+ CPLs on Google because one customer pays for years. LTV determines which platform is truly more profitable — not the cost per click or lead alone.
What Is Incrementality Testing and Why Does It Matter for ROI?
Incrementality testing measures lift — the sales that would not have happened without your ads. Both Facebook and Google tend to overclaim attribution; incrementality tests reveal the true ROI of each platform.
Facebook Ads vs Google Ads Cost by Industry
Industry benchmarks reveal wide variation in ad costs. The tables below break down CPC, CPM, and CPL by vertical for both platforms.
Industry-By-Industry Cost Comparison
Average CPC and CPM rates in the U.S. vary widely by industry. The table below compares Facebook and Google Ads benchmarks across major sectors — see our Facebook Ads vs Google Ads comparison for more detail.
Industry | Facebook CPC | Google CPC | Facebook CPM | Google CPM | Facebook CPL | Google CPL |
E-Commerce | $0.45 | $1.16 | $9.80 | $2.80 | $10-$25 | $30-$60 |
Real Estate | $0.70 | $2.37 | $10.50 | $3.50 | $15-$40 | $50-$120 |
SaaS / Technology | $0.85 | $3.80 | $13.20 | $4.20 | $30-$75 | $80-$200 |
Healthcare | $0.65 | $2.62 | $11.00 | $3.10 | $25-$60 | $50-$100 |
Legal | $1.32 | $6.75 | $14.80 | $5.60 | $40-$100 | $150-$300+ |
Medical Services | $0.72 | $2.62 | $12.50 | $3.80 | $20-$50 | $60-$150 |
Education | $0.55 | $2.40 | $11.80 | $3.20 | $18-$45 | $40-$120 |
Sources: WordStream, Revealbot, and Statista 2025-2026 industry benchmarks
Key takeaways by industry:
- E-Commerce: Facebook delivers the lowest CPC at $0.45, making it ideal for product discovery. Google’s lower CPM ($2.80) works well for remarketing via Display Network.
- Real Estate: Facebook’s visual ad formats and geo-targeting make it cost-effective for listing promotion at $0.70 CPC, while Google captures high-intent searches from active home buyers at $2.37 CPC.
- SaaS / Technology: Google’s higher CPC ($3.80) is justified by stronger purchase intent from users actively searching for software solutions. Facebook works better for top-of-funnel awareness.
- Healthcare: Both platforms offer competitive costs, but compliance requirements make Google’s search ads more straightforward for healthcare providers.
- Legal: The most expensive industry on both platforms. Google CPCs reach $6.75, but the high case value ($3,000-$50,000+) can justify the investment. Facebook at $1.32 CPC offers a lower-cost entry point for brand building.
How Much Do Facebook Ads Cost for E-Commerce?
E-commerce brands average $0.45 CPC on Facebook Ads compared to $1.16 on Google Ads. Facebook's lower cost per click makes it highly efficient for product discovery and retargeting campaigns.
How Much Do Google Ads Cost for Legal Services?
Legal service ads average $6.75 CPC on Google — among the highest of any industry. Facebook offers a more affordable $1.32 CPC for legal, making it a cost-effective alternative for brand awareness.
How Much Do SaaS Companies Pay for Ads?
SaaS companies average $3.80 CPC on Google Ads and $0.85 on Facebook. Google excels at capturing trial sign-up intent, while Facebook builds awareness for new software categories.
How Much Do Healthcare Ads Cost on Facebook and Google?
Healthcare advertisers pay $1.32 CPC on Facebook and $3.17 on Google. HIPAA compliance requirements limit targeting options, making Google intent targeting especially valuable for healthcare leads.
What Is the Average CPC for Finance Industry Ads?
Finance is among the most expensive verticals — averaging $3.77 CPC on Facebook and $5.10 on Google. High CPCs reflect the high lifetime value of financial product customers.
Budget Allocation: Google Ads vs Facebook Ads
For a channel-neutral view of what Google Ads costs on its own, see our Google Ads cost breakdown.
Splitting your budget between Facebook and Google ads depends on business stage, goals, and where your customers are in the buying journey. Use the facebook ads vs google ads cost data below as your guide.
Budget Planning and ROI Tips
Effective budget planning and ROI tips start with knowing your target cost per acquisition (CPA). Set aside 10-20% of your total ad budget for testing new audiences, creatives, or keywords before scaling.
Budget Split Frameworks
Here are proven starting frameworks based on business type:
- New brand, no search demand: 80% Facebook / 20% Google—build awareness first, capture branded searches as they develop
- Established brand with search demand: 40% Facebook / 60% Google—capture existing intent while building new audiences
- E-commerce with visual products: 60% Facebook / 40% Google—leverage discovery-based shopping on social, defend branded terms on search
- Local services: 20% Facebook / 80% Google—search intent dominates local purchase decisions
- B2B with long sales cycle: 50% Facebook / 50% Google—use both for different funnel stages
How to Calculate Ad Budgets
To calculate your ad budget for either platform, start with your target cost per acquisition (CPA) and work backwards: Budget = Target CPA × Number of conversions needed per month. For Facebook, add 20% for the algorithm's learning phase.
Minimum Budget Recommendations
To gather enough data for optimization on each platform:
- Facebook Ads: minimum $20-$30/day per campaign to exit the learning phase
- Google Search Ads: minimum $30-$50/day depending on your industry’s CPC
- Combined minimum for meaningful testing: $1,500-$2,500/month across both platforms
Start with one platform, establish profitability, then expand to the second. Splitting a small budget across both platforms often means neither gets enough data to optimize properly.
Budget Allocation for Small Businesses Under $5,000/Month
If your total advertising budget is under $5,000 per month, strategic allocation becomes even more critical. At this level, spreading too thin across both platforms can prevent either from generating actionable data.
Recommended approach for small budgets:
- Under $2,000/month: Pick one platform. Choose Facebook if you need awareness and have a visual product. Choose Google if people already search for what you sell. Invest 100% until you have consistent, profitable results.
- $2,000-$3,500/month: Lead with your primary platform at 70-80% of budget. Allocate the remainder to the secondary platform with a single, focused campaign—such as branded search on Google or retargeting on Facebook.
- $3,500-$5,000/month: Split 60/40 between your primary and secondary platform. You have enough budget for 2-3 campaigns on each. Focus on one objective per campaign to avoid diluting your spend.
At any budget level, prioritize these cost-saving strategies:
- Use lookalike audiences on Facebook built from your existing customer list
- Run exact match and phrase match keywords on Google to avoid wasted spend on broad queries
- Set up cross-platform retargeting: show Facebook ads to Google visitors and vice versa
- Review search term reports weekly to add negative keywords and cut wasted spend
When Should You Increase Your Ad Budget?
Increase your ad budget when campaigns show consistent ROAS above your target. If you have profitable campaigns with high impression share loss due to budget, scaling spend is the logical next step.
What Is a Good Cost per Acquisition for Google Ads?
A good Google Ads CPA depends on your product margin. Aim for CPA below 20-30% of your average order value. Most e-commerce advertisers target $15 to $50 CPA for standard products.
How Do You Scale Facebook Ads Without Raising CPA?
Scale Facebook Ads gradually — increase budgets by 20% every 3-5 days. Rapid budget increases reset machine learning, causing CPA to spike before the algorithm re-optimizes.
How Do Seasonal Trends Affect Ad Costs?
Ad costs peak in Q4 due to holiday competition. Facebook CPMs can increase 40-80% in November-December. Plan higher budgets for Q4 or shift spend to less competitive channels during peak periods.
What Is Campaign Budget Optimization on Facebook?
Campaign Budget Optimization (CBO) lets Facebook automatically distribute budget across ad sets. CBO typically reduces CPA by 10-20% compared to manual budget allocation across well-performing ad sets.
How Does Smart Bidding Affect Google Ads Cost?
Smart Bidding uses machine learning to optimize bids in real time. Target CPA and Target ROAS strategies can lower effective costs by 15-30% once campaigns have 30+ conversions per month for training data.
When to Use Facebook Ads vs Google Ads
Deciding which platform is right for your business depends on your goals, audience, and funnel stage. Here is a breakdown to help you decide based on your business needs and the facebook ads vs google ads cost dynamics.
Choose Facebook Ads When:
- You have a visual product that photographs or videos well
- Your target audience can be defined by interests, behaviors, or demographics
- You need to build awareness before people search for your solution
- Budget constraints require lower CPC
- Retargeting website visitors is a priority
If you’re just getting started, learning facebook ads for beginners can help you avoid common mistakes.
Choose Google Ads When:
- People actively search for your product or service category
- High purchase intent justifies higher CPC
- You’re in local services where search is the first action
- Your product solves an urgent, search-worthy problem
- Brand terms and competitor searches drive valuable traffic
Best Strategy: Use Both
- Run Facebook Ads for awareness and demand creation: Target cold audiences with interest-based and Lookalike campaigns to build brand familiarity.
- Use Google Ads to capture ready-to-buy traffic: Bid on high-intent search terms from users actively looking for your product or service.
- Retarget across both platforms: Serve Google Display and Facebook retargeting ads to users who have already visited your site or engaged with your content.
- Measure full-funnel attribution: Track view-through and click-through conversions to understand each platform's true contribution. A comprehensive meta ads funnel strategy connects both channels.
When Should You Switch from Facebook Ads to Google Ads?
Switch to Google Ads when your audience starts actively searching for your product or service. High search volume combined with low brand awareness indicates the market is ready for intent-based capture.
Which Platform Is Better for Local Businesses?
Local businesses often see stronger ROI from Google Ads due to high-intent local searches. Facebook is more effective for local brand awareness and event promotion targeting specific zip codes or cities.
Which Platform Is Better for Nonprofits?
Google Grants provides nonprofits up to $10,000/month in free Google Ads. Most nonprofits should exhaust Google Grants before paid Facebook campaigns to maximize cost-efficiency.
Which Platform Works Better for Restaurants?
Restaurants see strong results from Facebook and Instagram ads using local awareness campaigns. Google My Business ads and local search campaigns work well for capturing "near me" dining searches with high purchase intent.
How Do Seasonal Events Affect E-Commerce Ad Platform Choice?
During Q4 holiday sales, Google Shopping captures high-intent buyers searching specific products. Facebook Retargeting is highly effective for cart abandoners during Black Friday and Cyber Monday periods.
Which Platform Is Better for Event Advertising?
Facebook Ads excel at event promotion due to precise geographic and interest targeting and the social sharing effect. Google Search works better for users actively searching for events or tickets in a specific location or category.
Demand Creation vs Demand Capture: The Core Framework
Beyond the raw facebook ads vs google ads cost numbers, the fundamental difference lies in how each platform generates results. Facebook and Google operate on opposite sides of the demand spectrum, and this distinction directly affects what you should expect to pay and what you get for your money.
Facebook Ads: Demand Creation
Facebook is an interruption-based platform. Users are not searching for your product—they are scrolling through content from friends, creators, and brands. Your ad interrupts that experience and creates interest where none previously existed. This is demand creation.
Demand creation works best when:
- Your audience does not yet know they need your product or service
- You are launching a new category, brand, or offer
- Visual storytelling can spark emotional engagement
- You need to build a pipeline of future buyers before they start searching
Because you are creating demand from scratch, Facebook CPCs are lower ($0.62 average), but conversion rates from cold audiences tend to be lower as well. The payoff comes through retargeting and nurturing sequences that move people from awareness to purchase over time.
Google Ads: Demand Capture
Google is an intent-based platform. Users type a search query because they already want something. Your ad captures that existing demand and directs it to your offer. This is demand capture.
Demand capture works best when:
- People already search for your product category or solution
- Purchase decisions happen quickly after research
- You can match ad copy precisely to search intent
- Competitors are already bidding on your category keywords
Because you are capturing demand that already exists, Google CPCs are higher ($2.69 average), but conversion rates are also significantly higher. The user has already self-qualified by searching for a specific solution.
Why This Framework Matters for Cost
Comparing Facebook and Google on CPC alone is misleading without funnel context. A $0.62 Facebook click from a cold prospect and a $2.69 Google click from someone searching to buy represent completely different cost-per-acquisition outcomes.
A/B Testing Across Platforms
Effective cost optimization on both Facebook and Google requires structured testing. The testing approach differs significantly between platforms due to their different ad formats and optimization mechanics.
- Identify what to test first: On Facebook, start with creative variables (images, video hooks, headlines). On Google, start with keyword match types and bid strategies.
- Run one test at a time per platform: Isolate variables to get clear results. Testing multiple elements simultaneously makes it impossible to know what drove performance changes.
- Set a minimum test duration: Allow at least 7-14 days and aim for 50+ conversions per variant before drawing conclusions.
- Document and apply learnings: Track what works across both platforms. Creative insights from Facebook often inform Google Ads copy, and vice versa.
Facebook A/B testing priorities:
- Creative testing is the highest-leverage variable. Test different image styles, video hooks (first 3 seconds), and ad copy angles. Facebook’s algorithm optimizes delivery, so creative quality is your primary cost lever.
- Use Meta’s built-in A/B test feature to split audiences evenly and measure statistical significance. Run each test for at least 7 days with sufficient budget per variant.
- Test landing pages separately from ad creative. Change one variable at a time to isolate what drives cost improvements.
- Audience testing: broad targeting vs interest stacks vs lookalike audiences. In 2026, broad targeting with strong creative often outperforms narrow interest targeting due to Meta’s improved machine learning.
Google Ads A/B testing priorities:
- Ad copy testing is the primary lever. Test headlines, descriptions, and calls to action using Google’s ad variations or responsive search ads with pinned elements.
- Landing page testing has a direct impact on Quality Score, which affects your CPC. A higher-converting landing page can reduce your cost per click by improving your ad rank.
- Bid strategy testing: compare manual CPC, target CPA, and maximize conversions to find which delivers the best cost efficiency for your account.
- Keyword match type testing: exact match vs phrase match at the same bids to compare cost per conversion.
For both platforms, allocate 10-20% of your monthly budget specifically for testing. The insights from structured tests compound over time, steadily reducing your cost per acquisition on each platform.
Conversion Tracking: Why Setup Affects Your Reported Costs
Inaccurate conversion tracking is one of the most common reasons advertisers miscompare costs between Facebook and Google. If your tracking is inconsistent, your cost per lead and ROAS numbers will be unreliable regardless of which platform actually performs better.
Meta Pixel and Conversions API: Facebook requires the Meta Pixel on your website plus the Conversions API (CAPI) for server-side tracking. Since iOS 14.5 privacy changes, browser-only pixel tracking underreports conversions by 20-40%. Without CAPI, your Facebook CPL will appear inflated compared to reality, making Google look artificially better in comparison.
Google Tag and GA4: Google Ads uses the Google Tag (gtag.js) and integrates with GA4 for conversion tracking. Enhanced conversions, which hash and send first-party data back to Google, improve attribution accuracy. Google’s tracking generally reports more completely because search-to-conversion paths are shorter and less affected by cross-device and cross-browser privacy restrictions.
To compare costs fairly between platforms, ensure both have equivalent tracking setups: server-side tracking enabled, consistent conversion windows (7-day click or 28-day click), and the same definition of what counts as a conversion. Many advertisers who believe Google outperforms Facebook on cost efficiency are actually comparing complete Google data against underreported Facebook data.
What Is the Difference Between Facebook CPM and Google CPM?
Facebook CPM (cost per thousand impressions) averages $11.62 for feed placements. Google Display Network CPM averages $3.12 — significantly cheaper but with lower engagement. YouTube pre-roll ads CPM ranges from $4-$10, offering a middle ground.
How Long Do Facebook Ads Take to Work?
Facebook Ads need 7-14 days to exit the learning phase and start optimizing effectively. Meta recommends at least 50 optimization events per week for the algorithm to stabilize. Budget accordingly to allow the campaign sufficient time to gather data before making changes.
Which Platform Is Better for B2B Advertising?
Google Ads typically outperforms Facebook for B2B lead generation because buyers actively search for solutions. LinkedIn is preferred for enterprise B2B, but Google Search captures mid-market buyers at CPLs of $75-$200, often with stronger purchase intent than social platforms.
Which Platform Should Beginners Start With?
Beginners should start with Facebook Ads if they have a visual product or service and an undefined audience. Start with Google Ads if your customers are already searching for your product category. Facebook's algorithm is more forgiving with smaller budgets for testing.
How Does Attribution Work Differently on Facebook vs Google?
Facebook uses view-through and click-through attribution windows (default: 7-day click, 1-day view). Google uses last-click attribution by default but offers data-driven attribution in Google Ads. Both platforms can overcount conversions when running simultaneously due to attribution overlap.
What Is Quality Score in Google Ads?
Quality Score is Google's 1-10 rating of the relevance between your keyword, ad copy, and landing page. A higher Quality Score lowers your cost per click — ads scoring 8-10 can pay 50% less than competitors for the same ad position.
Reducing Your Facebook Ads vs Google Ads Cost: A Platform Optimization Guide
The facebook ads vs google ads cost comparison only tells part of the story. Reducing your effective cost per result requires platform-specific optimization strategies. Here are the most impactful levers for each platform.
How Does Ad Creative Quality Affect Facebook Costs?
Strong creative is the most powerful cost lever on Facebook. High-CTR ads lower CPM by improving your ad quality ranking. Test at least 3-5 variations per campaign to identify the top performer and cut underperformers quickly.
How Do Negative Keywords Reduce Google Ads Waste?
Negative keywords block irrelevant searches from triggering your ads. Most Google Ads accounts waste 20-40% of spend on irrelevant queries. A clean negative keyword list can cut wasted spend and lower effective CPC by 15-30%.
How Does Audience Overlap Increase Facebook Costs?
Overlapping ad sets bid against themselves in Facebook auctions, inflating CPM. Use Facebook's Audience Overlap tool to identify and consolidate competing ad sets, reducing internal competition and lowering effective costs.
How Does Dayparting Affect Google Ads CPC?
Dayparting schedules ads during peak conversion hours. Most B2B advertisers reduce costs 15-25% by focusing budgets on weekday business hours and pausing low-conversion late-night slots.
How Does Facebook Pixel Event Selection Affect Cost?
Optimizing for upper-funnel events like page views generates cheaper clicks but lower conversion rates. Optimizing for purchase events costs more per click but delivers better ROAS by training the algorithm on high-value actions.
How Do Keyword Match Types Affect Google Ads Spend?
Broad match captures more volume at higher CPC. Exact match and phrase match are more cost-efficient, targeting only searches with high purchase intent. Start with exact match and expand after identifying profitable query patterns.
How Do Lookalike Audiences Reduce Facebook CPL?
1% lookalike audiences built from purchasers or high-value customers typically reduce CPL by 30-50% compared to interest targeting. They leverage Meta's data to find users most similar to your best customers.
How Does Landing Page Speed Affect Google Ads CPC?
Google penalizes slow landing pages with lower Quality Scores, increasing CPC. Pages loading under 2 seconds earn significantly higher Quality Scores than pages taking 4+ seconds, directly lowering your cost per click.
What Is Facebook Budget Pacing and How Does It Affect Costs?
Facebook's standard delivery paces budget evenly across the day. Accelerated delivery spends faster and often raises CPM. Standard delivery is more cost-efficient for most campaigns unless timing is critical.
How Does Performance Max Affect Google Ads Cost Efficiency?
Performance Max campaigns automate placement across all Google channels. For advertisers with strong conversion data, PMax typically reduces CPA by 10-20% by finding the most efficient placements for each budget.
How Did iOS 14 Change Facebook Ads Costs?
Apple's iOS 14 ATT prompt reduced Facebook's tracking ability, limiting retargeting precision. This caused CPAs to rise 15-30% for many advertisers. Using Meta's Conversions API restores some lost signal.
Should You Bid on Competitor Keywords on Google Ads?
Bidding on competitor brand keywords averages 20-40% higher CPC than non-brand terms. It can be profitable if your conversion rate on branded competitor traffic is strong enough to justify the premium.
How Does Ad Fatigue Increase Facebook Costs?
Ad fatigue reduces CTR as the same audience sees your ad repeatedly. Refresh creatives when frequency exceeds 3-4 for cold audiences to maintain performance and prevent CPM increases.
How Does Auction Insights Help Control Google Ads Costs?
Google Auction Insights shows which competitors are bidding on your keywords. Use it to identify when competitors increase spend, so you can adjust bids or pause expensive keywords temporarily.
Facebook Ads vs Google Ads: Key Metrics to Track Cost Efficiency
Measuring the right metrics is as important as the facebook ads vs google ads cost comparison itself. These are the metrics that directly reflect ad efficiency on each platform.
What Is a Good CTR for Facebook Ads vs Google Ads?
Facebook Ads average 0.9% CTR for link clicks. Google Search Ads average 3-5% CTR. Higher CTR on Google reflects intent-based targeting, while Facebook's lower CTR is normal for interruption-based formats.
What Are Good Conversion Rate Benchmarks for Each Platform?
Google Search Ads average 3.75% conversion rate across industries. Facebook Ads average 9.21% conversion rate, higher due to lead form ad formats that remove friction. Compare conversion rates separately by campaign type.
What CPM Is Considered Efficient for Brand Campaigns?
Efficient CPM for brand awareness is under $10 on Facebook and under $5 on Google Display. If you exceed these benchmarks, reduce audience size, improve ad relevance, or test new placements to lower costs.
What Is a Good Cost per View for Facebook Video Ads?
Facebook video ad cost per 3-second view averages $0.01 to $0.03. ThruPlay campaigns (15 seconds) average $0.05 to $0.10. Video ads outperform static for awareness goals when CPV stays under $0.05.
What Impression Share Should You Target on Google Ads?
Target 70-80% impression share for branded keywords and 40-60% for competitive non-brand keywords. Impression share above 80% for all keywords often indicates overspending on low-value placements.
What Ad Frequency Benchmark Indicates Increasing Costs?
Frequency above 4 signals audience fatigue and rising CPM. Refresh creatives or expand audiences when frequency exceeds this threshold to maintain cost efficiency in Facebook campaigns.
How Do You Calculate True ROAS Across Both Platforms?
True ROAS = Total Revenue from Ads / Total Ad Spend. Use unified attribution to compare both platforms. Avoid comparing platform-reported ROAS directly since Facebook uses 7-day click attribution by default and Google uses 30-day.
What Metrics Should You Track in a Combined Ad Dashboard?
Track CPC, CTR, CPL, ROAS, and impression share weekly for both platforms. Use UTM parameters to feed both into a single analytics dashboard, enabling true cross-platform cost comparison and budget decisions.
How Much Do Facebook Carousel Ads Cost Compared to Single Image?
Facebook Carousel Ads often achieve 20-30% lower CPC than single-image ads due to higher engagement rates. Multiple cards allow showcasing several products or benefits, improving CTR and reducing cost per click.
How Does Google Shopping CPC Compare to Search CPC?
Google Shopping Ads average $0.66 CPC, significantly lower than Search Ads at $2.32. Shopping Ads show product images and prices in search results, pre-qualifying clicks and improving purchase conversion rates.
How Do Facebook Dynamic Ads Affect Cost for E-Commerce?
Dynamic Product Ads (DPA) typically achieve 30-50% lower CPA than static ads for e-commerce retargeting. They automatically show relevant products to users based on browsing history, improving both relevance and cost efficiency.
What Are Dynamic Search Ads and Do They Lower Cost?
Dynamic Search Ads auto-generate headlines from your website content, capturing long-tail queries you might miss. DSA campaigns typically extend reach by 10-20% while maintaining similar CPC to standard search campaigns.
Frequently Asked Questions
Common questions about facebook ads vs google ads cost, budgets, and platform selection — answered with data from 2026 benchmarks.
Are Google Ads Cheaper Than Facebook Ads?
Facebook ads average $0.62 CPC versus Google Search at $2.69 CPC, making Facebook cheaper per click. However, Google's higher costs reflect higher purchase intent, which often means better conversion rates and lower cost per customer acquired.
How Much Should I Budget for Facebook vs Google Ads?
Start where your customers are in the buying journey. Allocate more to Facebook for awareness-stage products with no search demand. Prioritize Google if people already search for your product. Most businesses start with a 60/40 split and adjust based on performance data.
Can I Run Both Facebook and Google Ads at the Same Time?
Yes, and most successful advertisers do. Facebook builds audiences and awareness, while Google captures demand when people search. Using both creates a complete funnel that neither platform can deliver alone.
What Is the Average Facebook Cost per Impression in 2026?
The average Facebook CPM in 2026 is $10-$14 for feed ads and $8-$12 for Stories and Reels. On a per-impression basis, this equals $0.010-$0.014 per impression for feed placements, depending on audience targeting and ad quality.
Are Wordstream Facebook Ads Benchmarks Still Accurate in 2026?
WordStream\'s Facebook ads benchmarks from 2024-2025 remain a solid reference for 2026. The average CPC of $0.62 and CPL of $27.66 align with current Revealbot and Statista data, though CPMs have risen 5-8% year over year due to increased advertiser competition.
Is $25 a Day Good for Facebook Ads?
Yes, $25/day ($750/month) is a reasonable starting budget for Facebook ads. At this spend level, you can run one well-targeted campaign and gather enough data to exit Meta's learning phase within 7-10 days. Focus on a single campaign objective.
Google Ads vs Facebook Ads: Which Is Better for Real Estate?
Both work well but serve different purposes. Google Ads captures high-intent buyers searching for properties at $2.37 CPC and $50-$120 CPL. Facebook Ads builds brand awareness through visual listings at $0.70 CPC and $15-$40 CPL.
Is $10 a Day Enough for Facebook Ads?
$10/day ($300/month) is technically enough to run Facebook ads, but the budget severely limits optimization. Meta's algorithm needs 50+ conversions per week to exit the learning phase. At $10/day, retargeting warm audiences works better than cold prospecting.
What Is the 20% Rule on Facebook Ads?
The 20% rule was a former Facebook policy rejecting ads with more than 20% text in the image. It was officially removed in 2020. Meta no longer rejects ads for text density, but heavy text overlays may still reduce ad delivery in some placements.
How Do You Split Budget Between Facebook and Google Ads?
Allocate 50-60% to Google if strong search demand exists, and the remaining 40-50% to Facebook for awareness and retargeting. If there is minimal search demand, flip the ratio to 60-70% Facebook. Review monthly and shift budget toward whichever platform delivers lower cost per customer.
Is $20 a Day Good for Google Ads?
$20/day ($600/month) is a viable starting budget for Google Ads in low-competition niches. For most industries, expect limited keyword coverage at this spend. Google recommends 10-20x your target CPA as a minimum daily budget to give the algorithm enough data to optimize.
Is $1,000 Enough for Facebook Ads?
$1,000/month is a workable budget for Facebook ads, enough to test one or two campaigns with clear objectives. At this level, focus on a single audience segment and track cost per lead weekly. Avoid spreading the budget across multiple ad sets until you identify what converts.
Which Platform Has Better Targeting: Facebook or Google?
Facebook Ads offers superior demographic and interest-based targeting, with access to Meta's behavioral data across Facebook and Instagram. Google Ads excels at intent-based targeting — reaching users at the exact moment they search for your product or service.
What ROAS Should You Target on Facebook Ads?
Target a minimum 3:1 ROAS on Facebook Ads for sustainable profitability. Well-optimized e-commerce campaigns often achieve 4:1 to 8:1 ROAS with strong creative and tight audience segmentation.
What Is the Average Monthly Cost of Facebook Ads?
Most small businesses spend $300 to $1,000 per month on Facebook Ads. Mid-market companies typically invest $1,000 to $10,000 monthly to generate meaningful reach and conversion data.
Can You Run Google Ads on a Small Budget?
Yes. A $500 monthly Google Ads budget can generate results in low-competition niches. Focus on long-tail keywords with lower CPC to maximize reach without overspending on broad, competitive terms.
Which Platform Is Better for Startups?
Startups often benefit from Facebook Ads first — lower CPCs, precise audience targeting, and faster feedback loops make it easier to validate offers before scaling with Google Ads.
Key Takeaways
Here is a summary of what the facebook ads vs google ads cost data shows for 2026:
- Facebook ads average $0.62 CPC versus $2.69 for Google Search ads
- Google Display offers cheaper impressions ($3.12 CPM) than Facebook ($11.62 CPM), but with lower engagement
- Facebook typically delivers lower CPL, but Google leads often have higher purchase intent
- Median ROAS is similar: Facebook 3-5:1, Google 3.5:1 for well-optimized campaigns
- The best strategy uses both platforms together for full-funnel coverage
- Budget allocation depends on business type: new brands should lean Facebook, established brands with search demand should lean Google
Ready to optimize your paid advertising budget? Stackmatix paid media services help venture-backed startups allocate budget effectively across Facebook and Google Ads — with full-funnel strategy, creative testing, and transparent reporting.