
A pitch deck traction slide shows one headline growth metric, a chart of that metric over time, three to five supporting numbers (revenue, customers, retention, or unit economics), and proof points like logos or testimonials. It proves your business has real momentum, not just an idea, in roughly 20 seconds of investor attention. It is one slide inside a full deck - see our how to build a pitch deck guide for the complete slide-by-slide structure.
This is the single slide inside a fundraising deck, not the same thing as the recurring reports you send your board after you've raised. If you're building the surrounding narrative, start with how to show traction to investors for the full story arc. This post is the tactical, slide-by-slide breakdown of the one slide that most often decides whether you get a second meeting.
What Goes on a Pitch Deck Traction Slide?
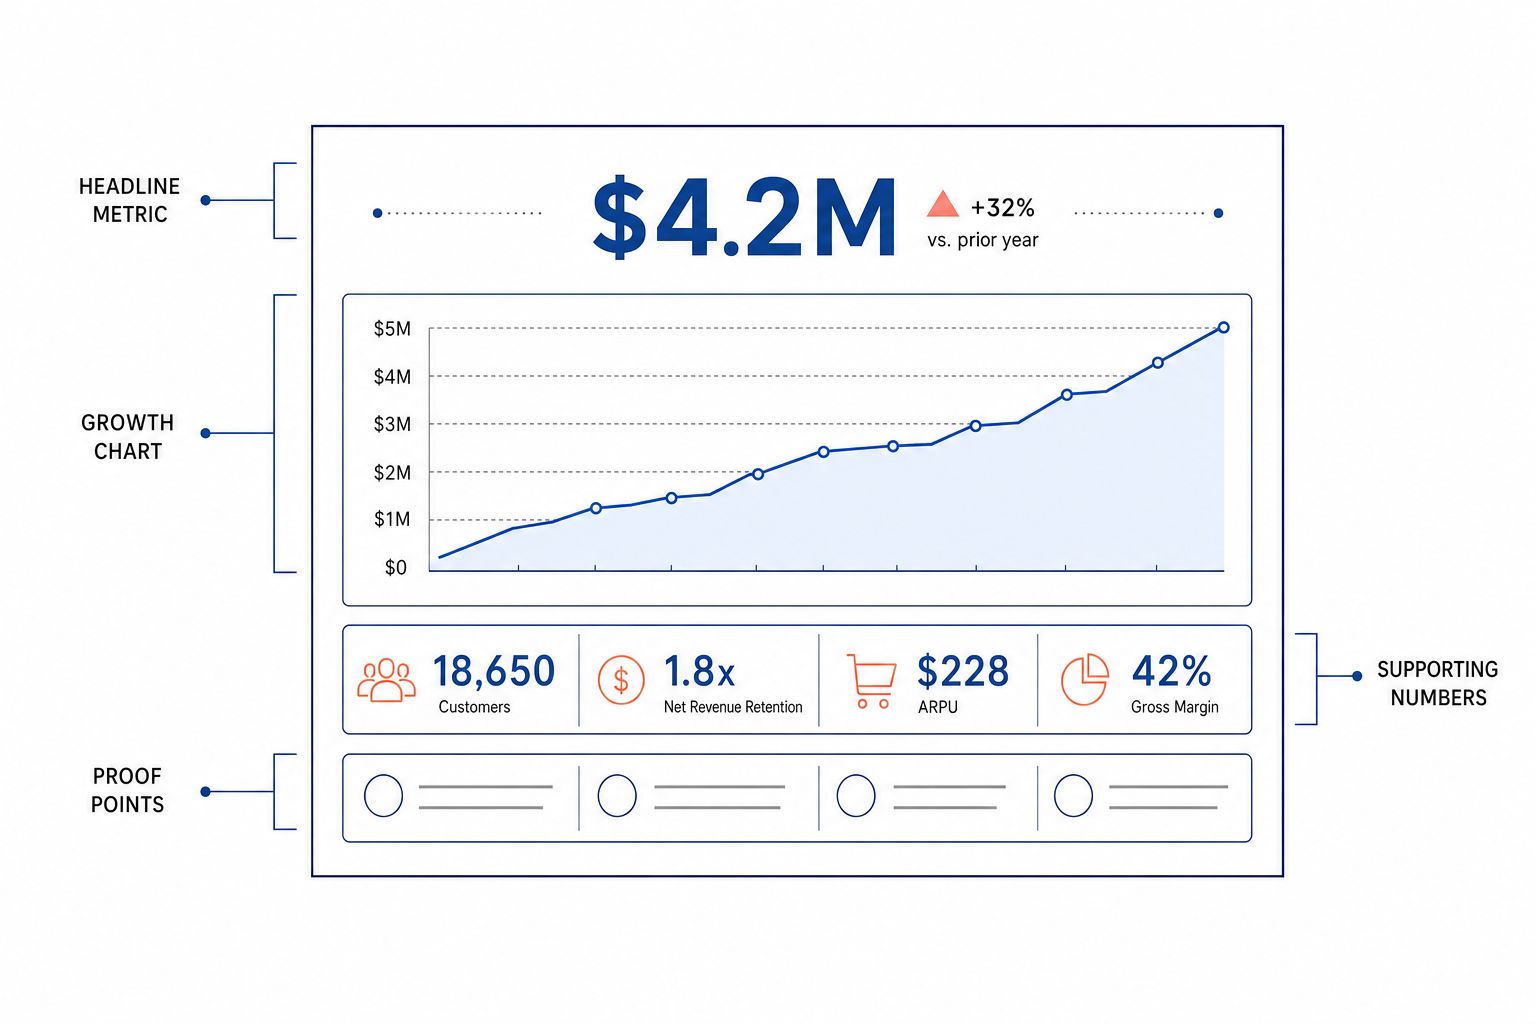
A strong traction slide has four parts, in this order of visual priority:
- Headline metric. Your single most impressive, most defensible number, stated in one line (example: "$2.4M ARR, 18% MoM growth").
- Growth visualization. A chart showing the metric's trajectory over time, not a single snapshot.
- Supporting metrics. Three to five secondary numbers that reinforce the headline (retention, CAC, gross margin, LTV:CAC).
- Proof points. Customer logos, press mentions, NPS score, or a short testimonial that humanizes the numbers.
Everything else is noise. If a number doesn't support the headline story, cut it from the slide and, if it matters, move it into the appendix or your marketing metrics that matter for follow-up questions.
How Is a Traction Slide Different from the Market Slide or Financials Slide?
Founders often blur these three slides together, and it costs them credibility. Each one answers a different investor question.
| Slide | Question It Answers | Time Frame |
|---|---|---|
| Traction | Is this actually working right now? | Past to present (proof) |
| Market | How big could this get? | Present to future (opportunity) |
| Financials | What will the business look like if this works? | Future (projection) |
Traction is evidence. Market size is opportunity. Financials are a forecast built on top of both. Never substitute a market-size chart for a traction chart - a large addressable market with no traction just tells an investor the idea is unproven at scale, not that it's working.
The traction slide is also distinct from ongoing investor updates. A fundraising deck's traction slide is a single, curated snapshot built to win a "yes." Recurring board reporting on growth metrics is a different, higher-frequency discipline built to maintain trust with investors you already have.
What Chart Should You Use on a Traction Slide?
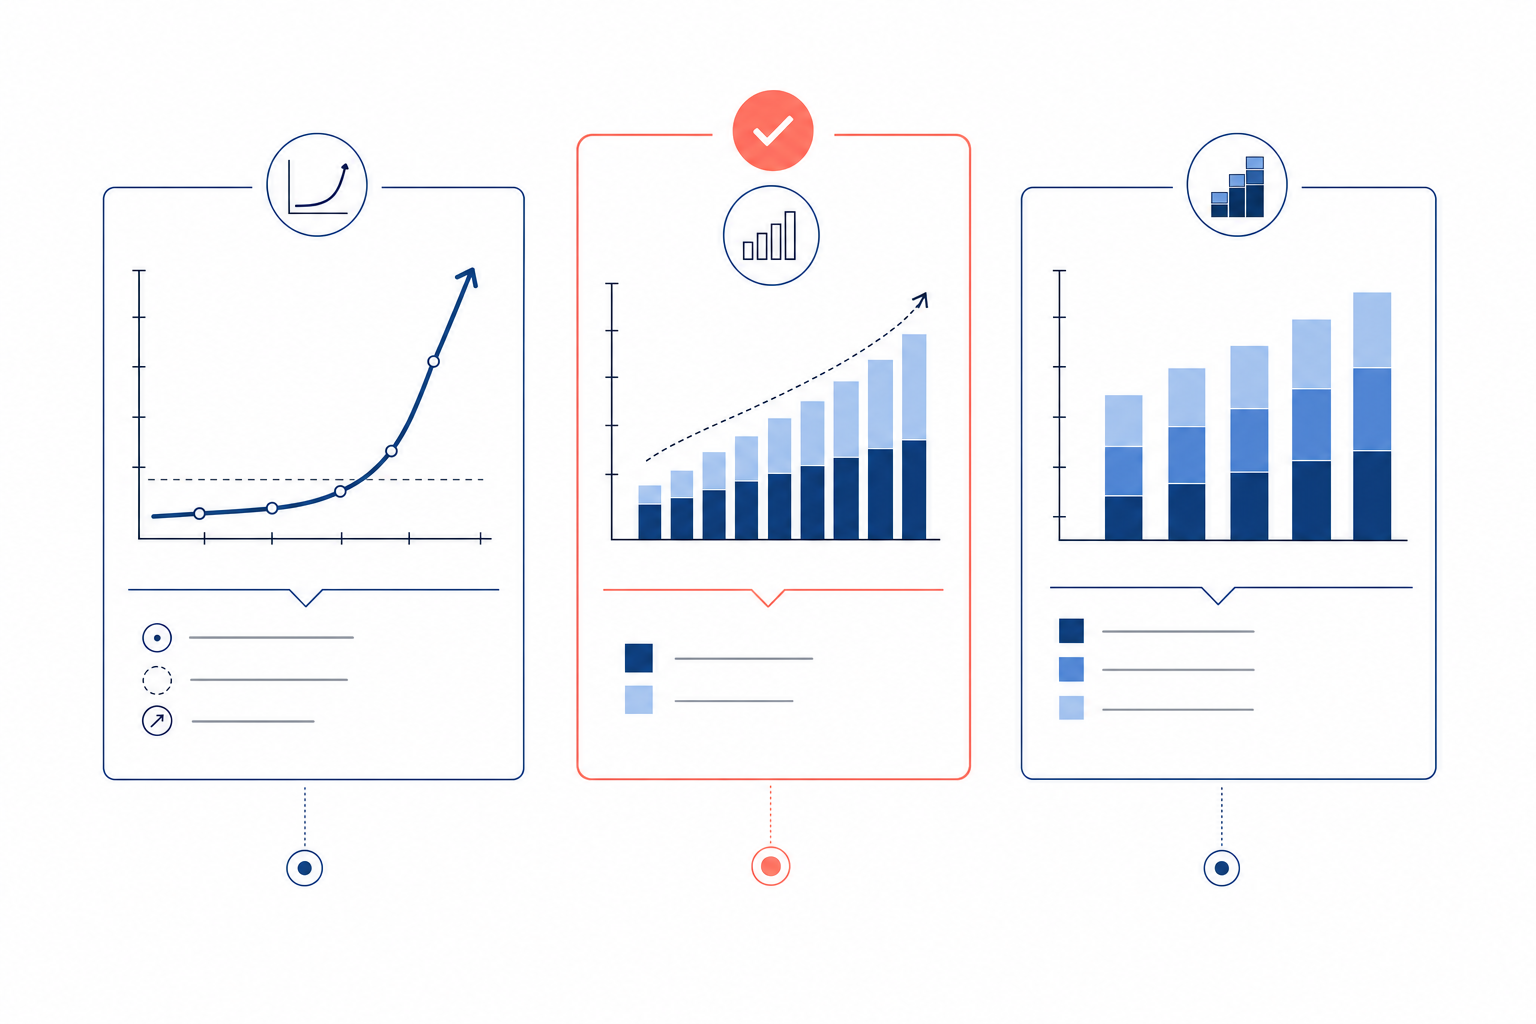
The chart matters almost as much as the number itself, since the shape of the curve is what investors actually remember. Match the chart type to the story you're telling.
| Chart Type | Best For | Avoid If |
|---|---|---|
| Line or area chart | Revenue or user growth over time; the classic "hockey stick" | You only have 2-3 data points |
| Bar chart | Period-over-period comparisons (quarterly ARR, monthly signups) | Growth is volatile month to month |
| Waterfall chart | Revenue bridges: new business, expansion, and churn in one view | Your audience is non-technical or time is short |
| Cohort table | Showing retention or expansion improves over successive cohorts | You don't yet have two full cohorts to compare |
Whatever chart you pick, start the y-axis at zero, use consistent time intervals, and label the axis. A chart that looks steep only because the axis is truncated is one of the fastest ways to lose investor trust once they notice.
What Should a Traction Slide Show by Funding Stage?
The right traction slide changes completely depending on your stage. Showing revenue metrics pre-revenue, or showing only a waitlist at Series A, signals you don't understand what investors expect from a company at your stage.
| Stage | What to Show | Example Headline |
|---|---|---|
| Pre-seed | Waitlist, LOIs, pilot usage, problem-validation interviews | "3,200 waitlist signups, 100% organic" |
| Seed | Early MRR, month-over-month growth, churn, NPS | "$52K MRR, 24% average MoM growth" |
| Series A | ARR, YoY growth, net revenue retention, LTV:CAC | "$2.8M ARR, 142% YoY, 124% NRR" |
| Series B+ | ARR scale, magic number, market share, revenue per employee | "$12M ARR, 0.8 magic number" |
For the full benchmark ranges behind each of these stages, see traction benchmarks by funding stage. That level of specificity is what separates a slide investors nod at from one they actually remember after the meeting ends.
What If You Have No Traction Yet?
Pre-traction founders still need this slide - skipping it looks worse than filling it with honest early signals. Use it to show:
- Customer discovery interviews and what they confirmed about the problem
- Letters of intent or signed pilot agreements
- Prototype or beta usage data, even if small
- Advisor or industry-expert endorsement of the approach
- Stated willingness to pay from target customers
Frame the slide around validation rather than scale: "here's proof the problem is real and people want this solved," not "here's proof we're already big."
What Are the Most Common Traction Slide Mistakes?
- Too many metrics. Ten numbers on one slide reads as "we're hiding weak performance behind noise." Cap it at three to five.
- Vanity metrics. Total signups, page views, and app downloads without a revenue or retention link don't move investors who've seen the pattern before.
- Hiding weak spots. Omitting churn or cherry-picking your best month gets caught in diligence and costs you credibility permanently.
- Wrong metrics for stage. ARR at pre-seed or a waitlist count at Series A both signal a mismatch with investor expectations.
- No time context. A number with no start date or growth rate attached is a snapshot, not traction. Always show the trajectory.
- Truncated or unlabeled axes. A chart engineered to look steeper than reality is one of the fastest ways to lose trust in the room.
Traction Slide Examples
Seed-stage consumer app: "$52K MRR, 24% average MoM growth, from $0 twelve months ago." Supporting line: 2,100 paying subscribers, 4.1% monthly churn (down from 7.2%), 72 NPS.
Series A B2B SaaS: "$2.8M ARR, 142% YoY growth, 124% NRR." Supporting line: 285 customers including recognizable logos, 4.2:1 LTV:CAC, 9-month CAC payback.
Notice both examples lead with one bolded headline, then back it up with three or four numbers - never the reverse.
Key Takeaways
- Put four things on the slide: a headline metric, a growth chart, three to five supporting numbers, and a proof point.
- Traction proves momentum now; market size proves future opportunity; financials project forward from both - keep them on separate slides.
- Match your chart to your data: line/area for steady growth, bar for period comparisons, waterfall for revenue bridges.
- Use stage-appropriate metrics - waitlist and pilots pre-seed, MRR and churn at seed, ARR and NRR at Series A and beyond.
- Cap the slide at 3-5 metrics, always with time context, and never truncate a chart's axis to fake a steeper curve.
- No traction yet is fine - lead with validation signals (interviews, LOIs, pilot usage) instead of skipping the slide.
Frequently Asked Questions
What Goes on a Traction Slide in a Pitch Deck?
A traction slide needs a headline growth metric, a chart showing that metric's trajectory over time, three to five supporting numbers such as retention or unit economics, and a proof point like a customer logo or testimonial. Everything beyond that belongs in the appendix, not the slide.
How Is a Traction Slide Different from a Market Slide?
A traction slide proves your business is working right now using past-to-present evidence. A market slide argues how big the opportunity could become using present-to-future sizing data. Investors read them as separate questions: is this real, and is this big.
What Chart Should I Use to Show Traction?
Use a line or area chart for steady revenue or user growth, a bar chart for period-over-period comparisons like quarterly ARR, and a waterfall chart when you need to show new business, expansion, and churn within one revenue bridge. Always start the axis at zero.
What If I Have No Traction Yet?
Still include the slide, framed around validation instead of scale: customer discovery interviews, signed letters of intent, pilot usage data, or advisor endorsement. Skipping the slide entirely reads worse to investors than an honest early-stage version of it.
How Many Metrics Should a Traction Slide Include?
Three to five metrics maximum, led by your single strongest headline number. Showing ten or more numbers signals to investors that you're hiding weak performance behind complexity rather than leading with a clear, confident story.