
Most seed-stage startups need early revenue or usage momentum plus a positive trend, not a fully proven business - think $5k-$20k in monthly recurring revenue, or a smaller pre-revenue product with strong retention and 10-15%+ month-over-month growth. Series A raises the bar sharply: roughly $1M-$3M in ARR growing 2-3x year over year is the commonly cited range, though it varies by sector and market conditions.
"How much traction do I need" is the wrong first question if you do not know what traction means at your stage. Pre-seed, seed, and Series A investors are underwriting different risks, so the traction bar - and what counts as traction at all - shifts at each one. This guide breaks down the typical thresholds stage by stage, with a reference table, so you can benchmark where you stand before you start pitching.
What Traction Do You Need to Raise a Pre-Seed Round?
Pre-seed investors are underwriting the team and the idea more than the metrics. Most pre-seed checks (commonly under $1M, often $250k-$750k) get written before there is meaningful revenue at all. What they want to see instead:
- A working prototype or MVP - not a finished product, but something a user can actually touch.
- Early signal from real users - a waitlist that is growing without paid acquisition, a design-partner agreement, or a handful of pilot users who keep coming back.
- Founder-market fit - direct, lived experience with the problem, or unusually deep domain insight that gives the team an edge on execution speed.
- Speed of learning - evidence you can ship, test a hypothesis, and iterate in weeks, not quarters.
Revenue at pre-seed is a bonus, not a requirement. If you have any - even a few hundred dollars a month from a handful of early customers - it meaningfully de-risks the round. If you do not, lean on engagement and validation signals instead: usage frequency, qualitative user feedback, or letters of intent.
How Much Traction Do You Need to Raise a Seed Round?
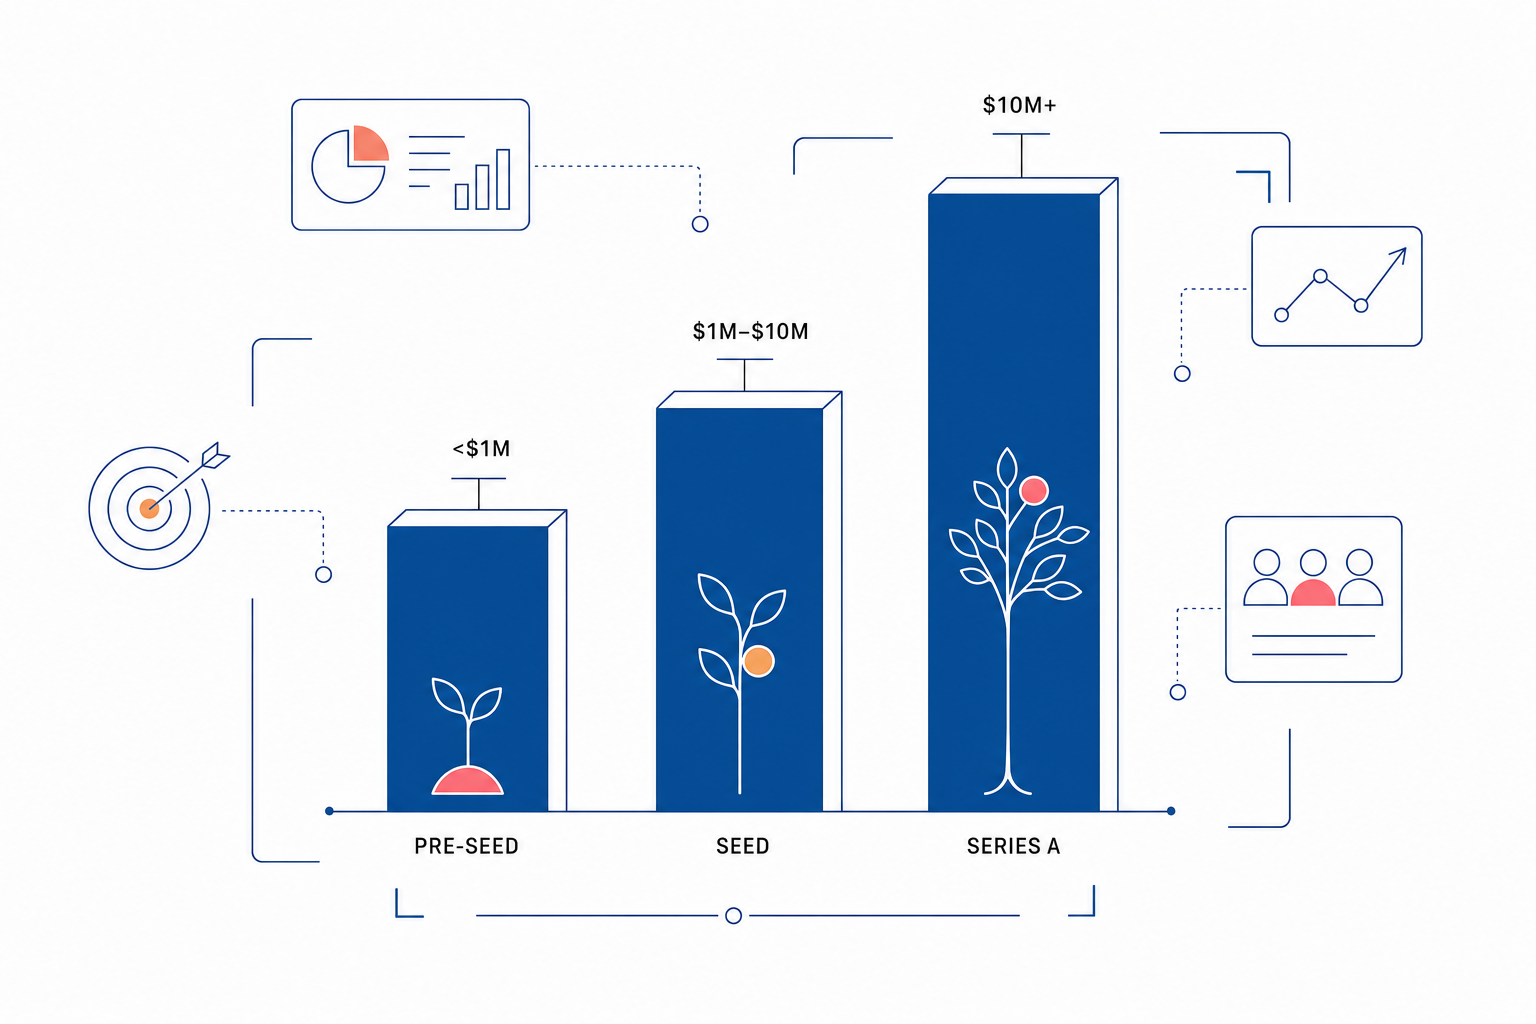
This is the question most founders are actually asking, and the honest answer is "it depends on what else you bring to the table" - but that is not useless if you break it into concrete ranges. For a SaaS or software startup, the traction bars seed investors commonly reference are:
- Revenue: roughly $5k-$20k+ MRR (or low six figures in ARR) at the time of raise, with a visible upward trend. Some seed rounds close pre-revenue, but they need to over-index on the other categories below.
- Growth rate: 10-20%+ month-over-month is the range that gets referenced as "raving" traction rather than "apathetic" traction. Six or more months of consistent growth matters more than any single month's number.
- Retention: a cohort curve that flattens rather than decays to zero - proof that users who try the product keep using (or paying for) it.
- Users or usage: for consumer or usage-based products without monetization yet, thousands of active users with real engagement (not just signups) can substitute for revenue.
- A repeatable channel forming: not a fully scaled growth engine, but early evidence that you know where your best users come from and can get more of them.
The market shifted after 2021: seed investors now want to see actual traction, not just a strong story and a big total addressable market. A founder with a standout background and deep market insight can still raise on a lighter traction bar; a first-time founder in an unfamiliar market usually needs more revenue, more users, or a longer proof trail to compensate. The strength of your team and market story and the strength of your traction data move on a sliding scale - more of one buys you slack on the other.
The more founder-market fit and prior credibility you have, the more flexible the traction bar. The less you have, the more revenue, retention, or engagement data you need to close the gap.
How Much Traction Do You Need for a Series A?
Series A is where "traction" stops being optional and starts being the primary underwriting input. The commonly cited benchmark is around $1M ARR as a rough historical floor, but more recent data on priced Series A rounds puts the median meaningfully higher - some datasets show median Series A ARR closer to $2M-$3M as round sizes and valuations have grown. Treat any single number as a floor, not a target: strong companies clear it, and plenty of good businesses need more before they are fundable.
What Series A investors are actually checking for:
- ARR in the neighborhood of $1M-$3M for B2B SaaS, varying by sector - infrastructure and dev-tools companies sometimes raise on less revenue with strong usage signals; commerce-adjacent or lower-margin businesses often need more.
- Sustained growth of roughly 2-3x year-over-year, or double-to-triple-digit percentage growth, with at least 6-12 months of consistent monthly trend data behind it.
- Proven product-market fit - shown through retention curves, expansion revenue (net revenue retention above 100% for B2B), organic/inbound demand, and low, explainable churn.
- A minimum viable scale before growth rate even matters - 50% monthly growth off $10k in revenue is a very different signal than 30% monthly growth off $100k. Investors weigh the base, not just the multiple.
- A credible, capital-efficient path to $100M+ in revenue - Series A investors are underwriting a venture-scale outcome, so they want to see the growth channels that got you here can be doubled down on, not just replicated by luck.
In short: Series A traction is about proof of a repeatable, scaling business, not early signal. If you are still discovering your growth channel or your retention curve is unclear, you are more likely still in seed-stage territory, whatever your revenue number says.
Traction Benchmarks by Stage: Reference Table
| Stage | Typical traction bar | Example metrics |
|---|---|---|
| Pre-seed | Idea + team credibility; traction is a bonus, not required | Working prototype, growing waitlist, design partners, early user feedback loops |
| Seed | Early product-market fit signal with an upward trend | $5k-$20k+ MRR or equivalent early ARR, 10-20%+ MoM growth, retaining cohorts, one channel starting to work |
| Series A | Proven, repeatable growth at meaningful scale | ~$1M-$3M ARR, 2-3x YoY growth, net revenue retention 100%+, clear scalable channel(s) |
Treat these as general ranges, not hard cutoffs. Capital-intensive sectors, regulated industries, and hardware businesses often run on different traction math than B2B SaaS - and hot markets or a standout team can move the bar in either direction.
How Have Traction Bars Shifted in the Current Market?
Rounds got bigger and later-stage-looking through 2020-2021, then the bar reset sharply higher starting in 2022 as capital tightened. A few durable shifts worth knowing:
- Seed rounds now often look like what used to be Series A - more revenue, more proof, before the same size check gets written.
- Capital efficiency matters as much as growth rate. Investors want to see you can extend runway and hit milestones without burning at a 2021-style pace.
- "Traction" now leans harder on quality over quantity - net revenue retention, low churn, and organic demand are weighted more heavily than raw top-line growth alone.
- AI-era rounds are an exception in some categories - a subset of AI startups are raising seed and Series A rounds on thinner traction than the historical norm, driven by category excitement rather than typical proof points. This is not the reliable path for most founders and tends to compress again as the category matures.
Key Takeaways
- Pre-seed: team and idea carry the round; traction (if any) is early signal, not proof.
- Seed: look for roughly $5k-$20k+ MRR or equivalent, 10-20%+ MoM growth, and a positive retention trend - or strong compensating signal if pre-revenue.
- Series A: commonly cited benchmarks cluster around $1M-$3M ARR with 2-3x YoY growth and proven retention, though this varies by sector.
- The bar is a sliding scale, not a fixed number - stronger founder-market fit and team credibility buy slack on the metrics, and vice versa.
- Post-2022, investors weigh capital efficiency and retention quality more heavily than raw growth rate alone.
Once you know where your numbers should land for your target stage, the next step is packaging that data into a story investors can act on. See how to show traction to investors for the full framework, how to build your pitch deck traction slide for layout specifics, and which growth KPIs to track at each startup stage if you are not yet sure which numbers to instrument. If you are earlier in the journey, the pre-seed to Series A marketing playbook covers how to build the traction itself, and marketing due diligence for startups covers how investors verify the numbers you present.
FAQ: Traction Benchmarks by Funding Stage
How much traction do I need to raise a seed round?
Most seed investors want to see early product-market fit signal: commonly $5k-$20k+ in monthly recurring revenue (or an equivalent early usage base), 10-20%+ month-over-month growth sustained for several months, and a retention curve that flattens instead of decaying to zero. Pre-revenue seed rounds do happen, but they need stronger signal in the other categories - team, market insight, and user engagement - to compensate.
How much ARR do you need to raise a Series A?
The commonly cited range is roughly $1M-$3M in ARR, though more recent data suggests the median has drifted toward the higher end of that range as round sizes have grown. The number alone is not enough - investors also expect 2-3x year-over-year growth, proven retention, and a clear, scalable acquisition channel behind the revenue.
What counts as traction if I do not have revenue yet?
Retention and engagement data (repeat usage, cohort curves), a growing waitlist without paid acquisition, signed letters of intent or design-partner agreements, and organic word-of-mouth or press interest all count as traction. The strongest pre-revenue traction stories show a clear trend toward paid demand, not just curiosity.
Do traction benchmarks differ by industry?
Yes. B2B SaaS benchmarks (ARR, net revenue retention) do not map cleanly onto marketplaces, hardware, or regulated industries, which often use different proof points like transaction volume, unit economics, or regulatory milestones. Capital-intensive and infrastructure-heavy categories generally need more capital efficiency proof than pure software plays at the same traction level.
Has the traction bar for fundraising gone up since 2021?
Generally yes. Since the market correction that began in 2022, seed and Series A investors have asked for more revenue and proof at the same round size than they did during the 2020-2021 peak, and they weigh capital efficiency and retention quality more heavily than raw growth rate alone. A notable exception is some AI-category startups, which have raised on thinner traction due to category-level investor excitement rather than typical proof points.