
To show traction to investors, assemble proof across four buckets - revenue or usage growth, retention, a repeatable acquisition channel, and third-party validation - then frame it as a growth story with a clear before/after arc, not a data dump. Investors are not buying metrics; they are buying evidence that your growth is real, repeatable, and about to accelerate with their capital.
That framing matters more than founders think. Two startups can show the same MRR chart and get opposite reactions - one gets a term sheet, the other gets ghosted - because one told a story an investor could underwrite and the other just reported numbers. This guide covers what evidence to gather, how to structure the narrative arc, and the proof points that actually move a fundraising decision. It is the hub for a deeper series - jump to the traction slide format, the traction bar by funding stage, or what investors check in marketing due diligence when you need the specifics.
What Does "Traction" Actually Mean to Investors?
Traction is evidence that real people want what you built, are paying for it or using it repeatedly, and that the way you got them to do so can be repeated at larger scale. It is not a single metric - it is a pattern across multiple signals that, together, de-risk the bet an investor is being asked to make.
Investors are not scoring you against a universal traction rubric. They are asking three underlying questions, and every metric you show is really an answer to one of them:
- Is there a real problem being solved? (market validation)
- Can this team execute, not just plan? (execution proof)
- Can growth get bigger without getting proportionally harder? (scalability)
A startup with modest revenue but a clean, repeatable paid-acquisition channel and improving unit economics often reads as lower-risk than a startup with a bigger revenue number built on one-off deals or founder-network sales that will not repeat.
What Traction Evidence Should You Assemble Before You Pitch?
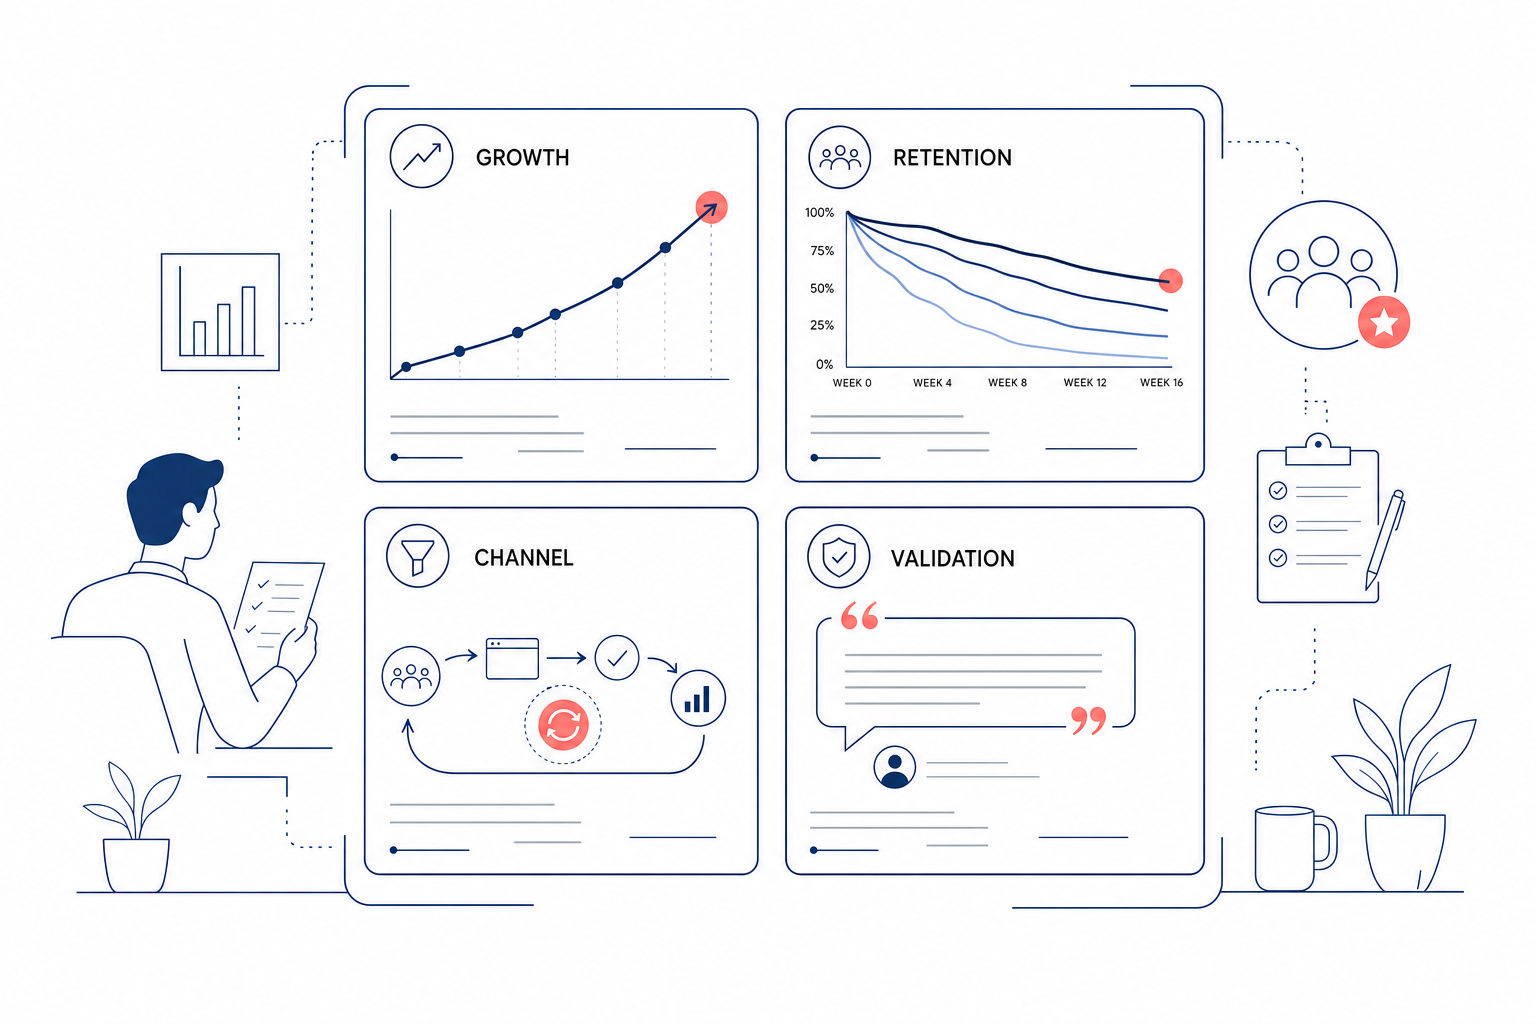
Before you write a single slide, pull the underlying evidence into four categories. Each one answers a different investor doubt, and a narrative built on only one category (usually revenue) is the most common reason a traction story falls flat.
| Proof category | What it proves | Example evidence |
|---|---|---|
| Growth & revenue | Demand is real and increasing | MRR/ARR trend, month-over-month growth rate, paid pilot conversions |
| Retention & engagement | The product delivers repeat value, not just a first click | Net revenue retention, cohort retention curves, DAU/MAU, churn trend |
| Channel repeatability | Growth is a system, not a coincidence | CAC by channel over time, payback period, attribution by source, organic-vs-paid mix |
| External validation | Independent parties vouch for you | Enterprise logos, signed LOIs, press coverage, analyst mentions, advisor/investor endorsements |
Notice what is missing from that table: vanity metrics. Total signups, app downloads, social followers, and page views without a conversion or retention story attached are the fastest way to lose credibility with an experienced investor - they have seen thousands of decks that lean on them because the underlying number is weak.
How Do You Turn Metrics into a Growth Story?
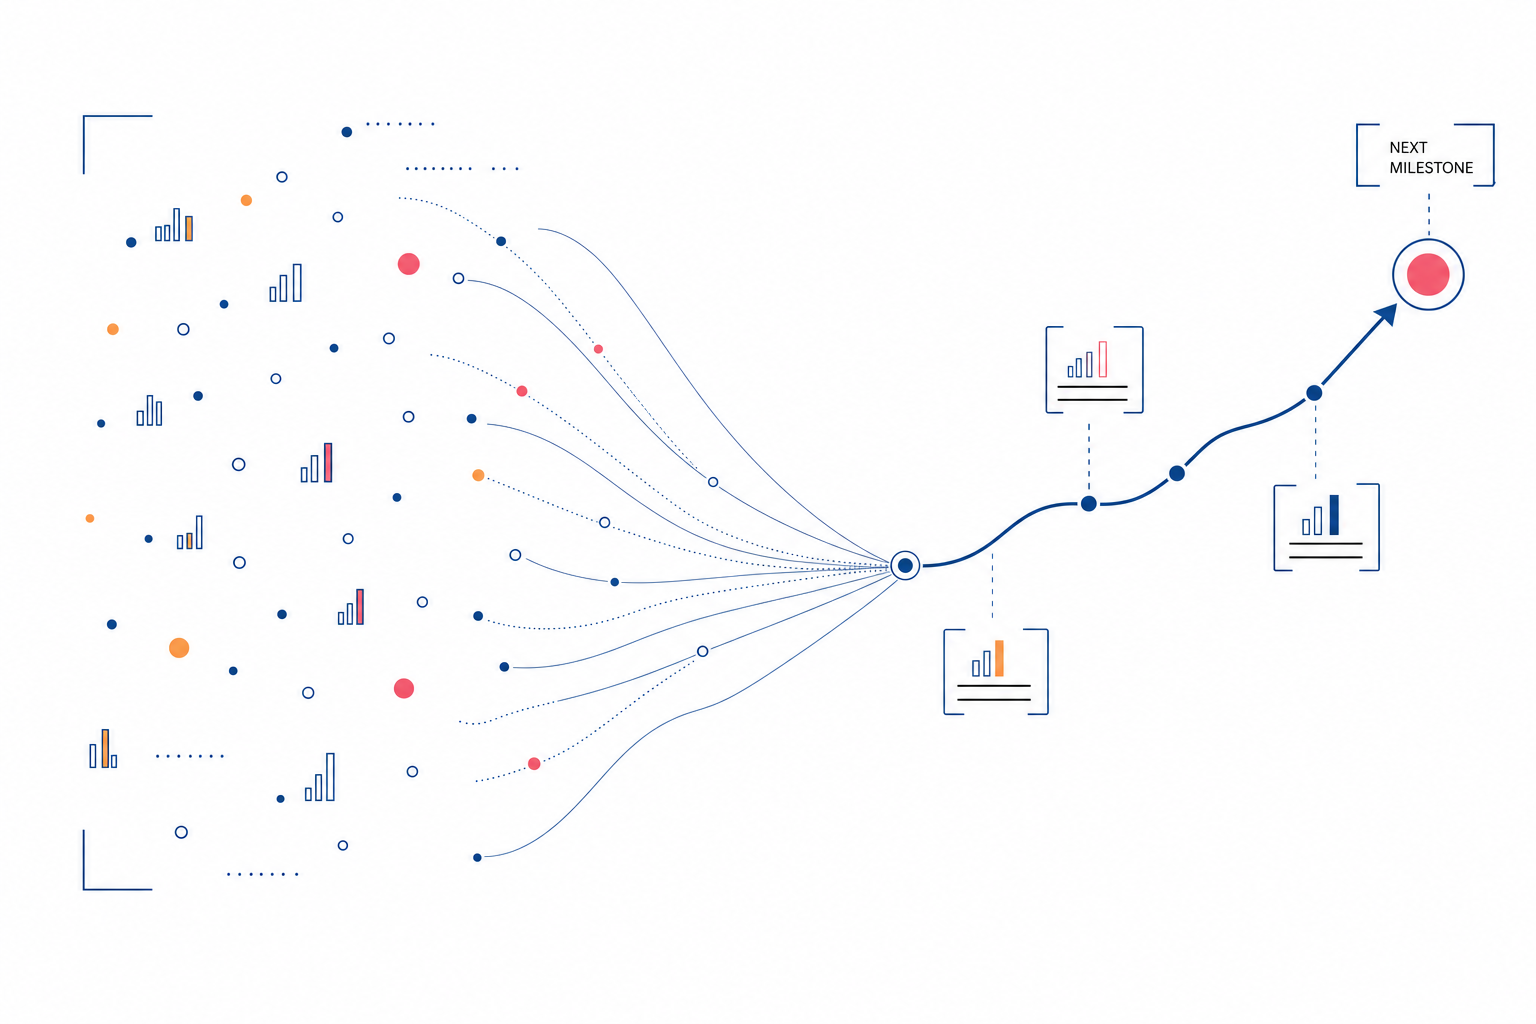
A chart is not a narrative. Investors sit through pitch after pitch of the same "up and to the right" line chart, so the number itself rarely differentiates you - the story around it does. The strongest traction narratives follow a simple arc:
- The starting problem. What was true before you found your growth lever - flat, slow, or expensive customer acquisition.
- The inflection point. What specifically changed - a channel that started working, a pricing change, a feature that fixed activation, a segment that clicked.
- The evidence it repeats. Show the same mechanism working across more than one cohort, month, or market - not a single spike.
- The forward trajectory. Connect the pattern to what capital unlocks - more of the same channel, a new segment using the same playbook, geographic expansion.
This is the piece most founders skip: they present the inflection point as the whole story. Investors weigh repeatability more heavily than the size of any single number, because a repeatable pattern is the thing their capital is meant to amplify. If you need help turning raw GA4, ad platform, and CRM exports into that kind of narrative, see how to build a fundraising narrative from your marketing analytics.
What Makes a Growth Channel "Repeatable" In Investors' Eyes?
A channel is repeatable, not lucky, when three things hold true across at least two or three consecutive periods:
- Stable or improving CAC as spend or effort scales, rather than a channel that only worked once at small volume.
- Consistent conversion rates from the channel into paying customers, not just traffic or leads.
- A documented playbook - you can explain, step by step, why it worked, which means someone else (or more budget) could run it again.
Founders who cannot answer "why did this work" for their best-performing channel usually cannot defend it under diligence questioning either. Pair the channel story with the funnel-level context described in growth KPIs that matter at your specific stage so you are not reporting metrics an investor will consider irrelevant for your size.
How Much Traction Do You Need at Each Funding Stage?
There is no universal traction bar - a pre-seed check and a Series A term sheet are underwritten against completely different evidence. In general, expectations step up like this:
| Stage | Primary traction expectation | Common proof |
|---|---|---|
| Pre-seed | Problem validation, early usage signal | Waitlist, design partners, first users, qualitative demand evidence |
| Seed | Early product-market fit signal | Initial revenue or activation data, retention trend, one working acquisition motion |
| Series A | Repeatable growth engine | Consistent MoM growth, proven CAC/LTV economics, at least one scalable channel |
| Series B+ | Efficient, diversified growth at scale | Multiple channels, improving efficiency metrics, expansion revenue |
Trying to hit Series A-level growth-rate expectations at a pre-seed pitch (or worse, showing pre-seed-level anecdotes at a Series A) signals to investors that you do not understand your own stage. For the full breakdown of what "enough" looks like at each round, see traction benchmarks by funding stage.
Where Does the Traction Story Actually Show Up in a Raise?
The traction narrative is not a single document - it has to survive across three different touchpoints, each with a different level of scrutiny:
- The pitch deck. A single, tightly framed slide (usually slide 2-4) with the headline metric and the story behind it, not a wall of charts. See how to build the traction slide itself for layout and framing.
- Follow-up materials. A data-room appendix or one-pager with the underlying cohort data, channel breakdowns, and methodology notes investors will ask for after the first meeting.
- Diligence. Once a term sheet is on the table, the same numbers get pulled apart - analytics access, ad account exports, CRM data - to confirm they hold up. Founders who cannot reproduce their own deck numbers under diligence lose deals at the finish line. Prepare for this with what investors check in marketing due diligence.
It helps to think about the whole raise through the lens of what a VC-backed company is expected to demonstrate on an ongoing basis, not just at the pitch. Investor expectations for marketing at VC-backed startups covers what boards and lead investors look for after the check clears - which is the same evidence bar you should be building toward now.
What Mistakes Sink a Traction Narrative?
Most weak traction pitches fail for the same handful of reasons:
- Leading with vanity metrics. Downloads, signups, and impressions without a conversion or retention number attached read as filler.
- No context or benchmark. A growth rate means nothing without a comparison to what "good" looks like at your stage and sector.
- Cherry-picked time windows. Showing only the best three months invites investors to ask what the other months looked like - and they will ask.
- One-time spikes presented as a trend. A single viral moment, press hit, or launch bump is not a channel until it repeats.
- Numbers that do not survive diligence. Inflated or unverifiable figures cost far more in a broken deal than a smaller, defensible number ever would.
Key Takeaways
- Traction is evidence across four buckets - growth, retention, repeatable channels, and external validation - not a single metric.
- Investors are really asking three questions: is the problem real, can the team execute, and does growth scale without breaking.
- Structure the story as an arc - starting problem, inflection point, proof it repeats, forward trajectory - not a static chart.
- A channel is repeatable only if CAC and conversion hold steady across multiple periods and you can explain why it worked.
- Traction expectations scale sharply by stage; match your evidence to your round, not the round above you.
- The same numbers have to survive the deck, the follow-up data room, and diligence - so start from evidence you can defend, not just present.
Investors also triage with AI assistants, so review your AI search visibility for investor diligence.
Getting traction in front of investors is only half the work; the other half is marketing your raise like a campaign. Our investor marketing playbook for startups covers building warm momentum with the right investors before you ever send the deck.
Founders often ask how to show this traction inside an accelerator application; our YC application guide covers the application and demo.
The same metric set works in partner sessions -- see prepping marketing metrics for accelerator office hours.
Frequently Asked Questions
What Is the Difference Between Traction and Revenue?
Revenue is one input into traction, not the whole picture. Traction also includes retention, engagement, channel repeatability, and external validation like signed LOIs or press coverage - a pre-revenue startup can still show strong traction through waitlist growth, pilot conversions, or usage retention.
How Much Traction Do I Need Before Raising a Seed Round?
Seed investors generally look for an early product-market fit signal - some initial revenue or activation data, a positive retention trend, and at least one acquisition motion that is starting to work - rather than a fully proven growth engine, which is more of a Series A bar. See the stage-by-stage breakdown in the traction benchmarks post for specifics.
What If I Do Not Have Revenue Yet - How Do I Show Traction?
Lean on the other three proof categories: retention or engagement signals (repeat usage, waitlist growth), channel evidence (where your early users are coming from and whether it is repeatable), and external validation (design partners, LOIs, advisor endorsements, press). Pre-revenue traction stories work when they show a clear trend toward paid demand, not just interest.
What Is a Good Traction Slide Format for a Pitch Deck?
The strongest traction slides lead with one headline metric framed against a benchmark, show a clean trend line rather than a cluttered dashboard, and pair the chart with one sentence explaining why the trend is repeatable. Full layout guidance is in the dedicated traction slide post.
How Do Investors Verify Traction Claims During Due Diligence?
Investors typically request direct access to the systems behind your numbers - analytics platforms, ad account exports, CRM records, and payment processor data - to confirm the figures in your deck match the underlying source data. Numbers that were rounded up, cherry-picked, or built on undisclosed one-time events tend to surface here, which is why the deck story and the data room story need to match exactly.